For education only. Not investment advice.
Trading Guides
Guides on trading strategies, risk, trading costs, psychology and smart money concepts. Strategy guides show our own test results after costs, losers included; the rest have worked examples in ₹ and $ and a free tool to check the numbers.
Smart money concepts (SMC)
Market structure the SMC way, the terms in plain words and what our tests on six years of data found.
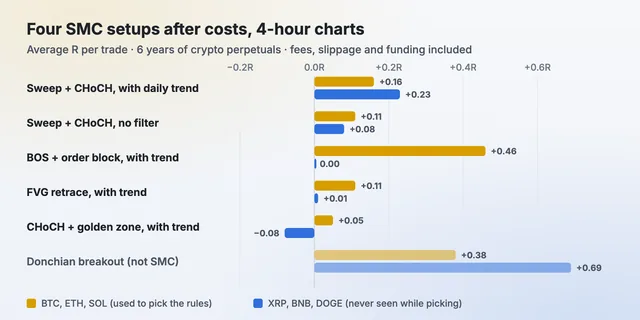
Smart Money Concepts (SMC), Tested on 6 Years of Data
Smart money concepts explained: market structure, BOS, CHoCH, liquidity, order blocks, FVGs, premium and discount, and how 4 SMC setups did on 6 years of data.
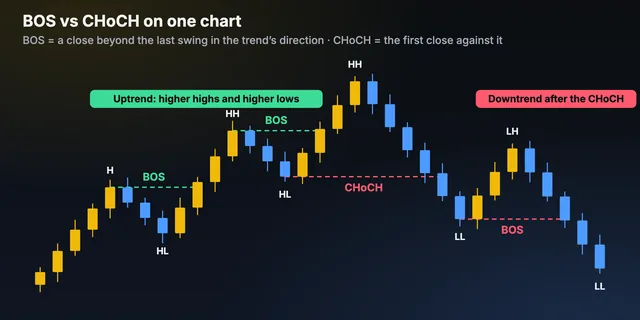
BOS vs CHoCH: What’s the Real Difference?
BOS (break of structure) confirms a trend; CHoCH (change of character) is the first break against it. How to mark both, close vs wick, and the mistakes to avoid.
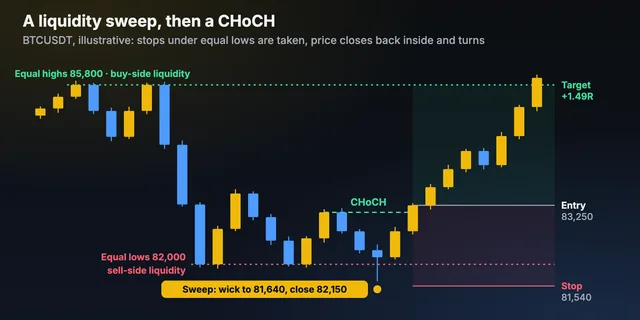
Liquidity Sweep: What It Is and What Happens After
A liquidity sweep is a quick run past a high or low that takes the stops there, then closes back inside. How to spot one, what comes next and how to trade it.
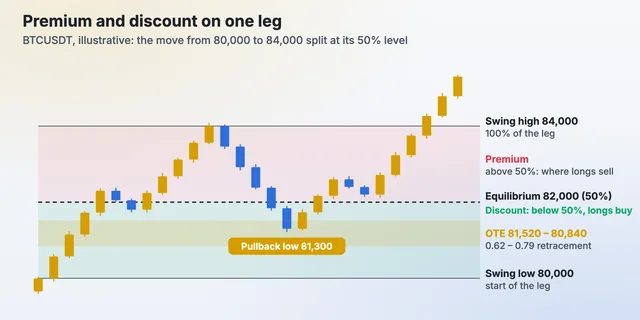
Premium and Discount Zones, Explained
Premium and discount split a price range at its 50% level: buy in discount, sell in premium. How to draw the range, the OTE zone, ₹ and $ examples and mistakes.
Trading strategies, tested
Classic strategies run on six years of data after fees, slippage and funding, the losers included, and how to test your own.
Trading Strategies, Tested on 6 Years of Data
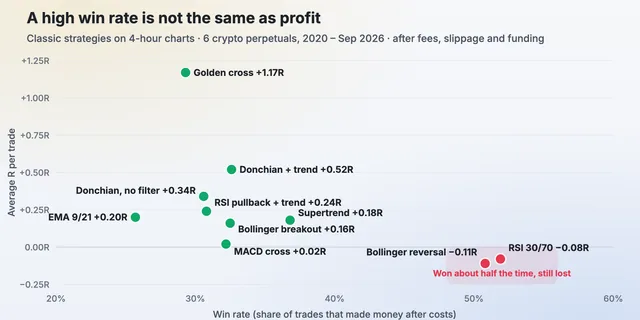
13 trading strategies (Donchian, golden cross, EMA, Supertrend, Bollinger, RSI, MACD, ORB) tested on 6 years of crypto data after fees: what worked and what lost.
How to Backtest a Trading Strategy
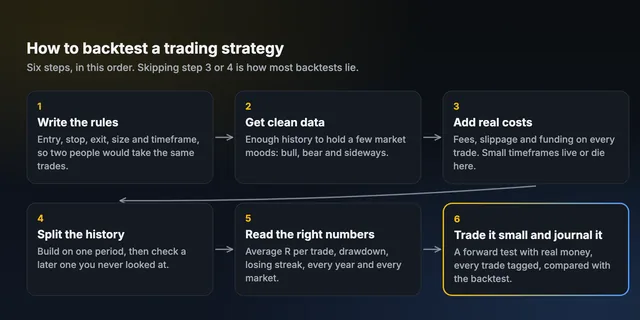
How to backtest a trading strategy: write exact rules, add real costs, test on an unseen period, read the right numbers and avoid the mistakes that make tests lie.
Donchian Channel Strategy: Rules and Test Results
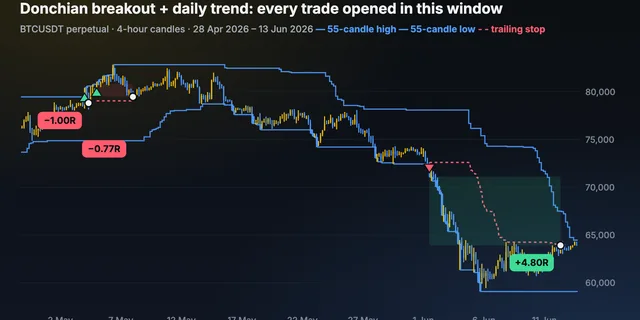
The Donchian channel breakout strategy (the Turtle rules), tested on 6 years of crypto data after costs: +0.52R a trade on 4-hour charts with a daily trend filter.
Golden Cross Strategy: Does It Work?
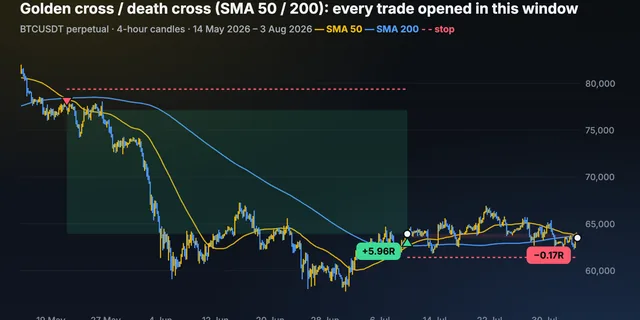
The golden cross and death cross (50/200 SMA) tested on 6 years of crypto data after costs: +1.17R a trade on 4-hour charts, weak on daily charts.
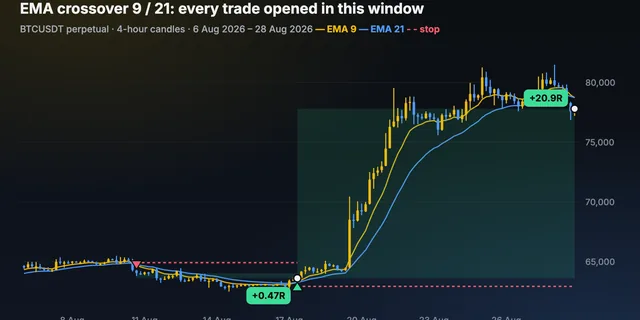
EMA Crossover Strategy: Rules and Test Results
The 9/21 EMA crossover tested on 6 years of crypto data after fees: it lost on 15-minute charts and made +0.20R a trade on 4-hour charts. Rules and results.
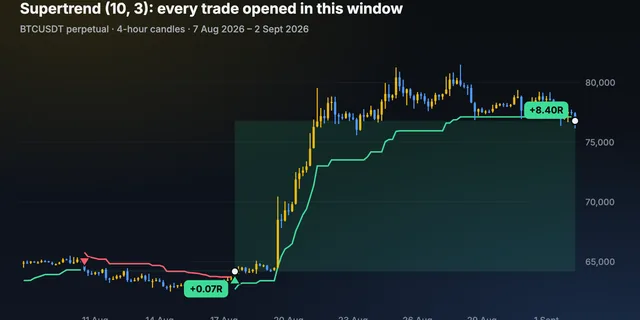
Supertrend Strategy: Settings, Rules and Test Results
Supertrend (10, 3) tested on 6 years of crypto data after costs: +0.18R a trade on 4-hour charts, a loss on 15-minute charts. Settings, rules and results.
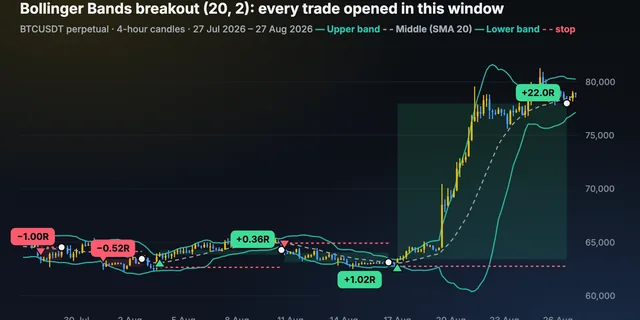
Bollinger Bands Strategy: Breakout or Reversal?
Bollinger Bands tested on 6 years of crypto data after costs: buying the lower band lost on every timeframe; breakouts made +0.16R a trade on 4-hour charts.
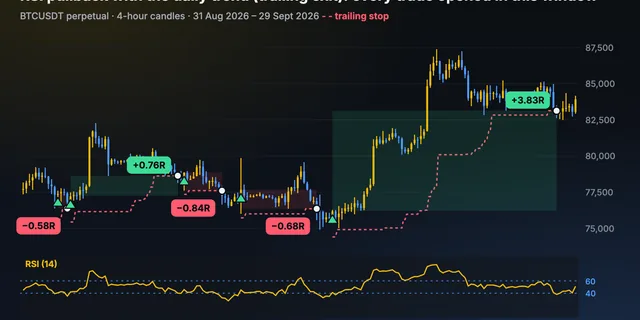
RSI Trading Strategy: Why 30/70 Fails, and What Worked
RSI 30/70 lost on every timeframe in our 6-year crypto test despite a 52% win rate. An RSI pullback with the trend made +0.24R a trade on 4-hour charts.
Risk management
How much to risk, where the stop goes, how to trail it, what a drawdown costs and what fees take from each trade.
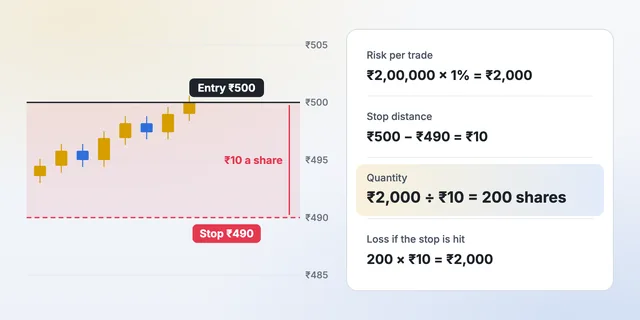
Position Sizing in Trading: How to Calculate It
Position sizing decides how much you lose when you are wrong. The formula, worked examples for stocks, Nifty options, forex and crypto, and common mistakes.
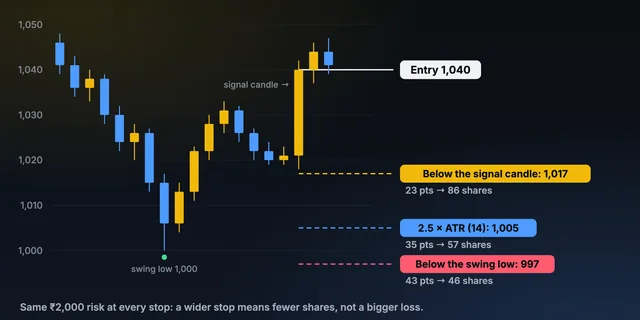
Stop Loss in Trading: What It Is and Where to Put It
What a stop loss is, the order types (SL, SL-M, trailing), five ways to decide where to put it, common mistakes, and how to size the trade once the stop is set.
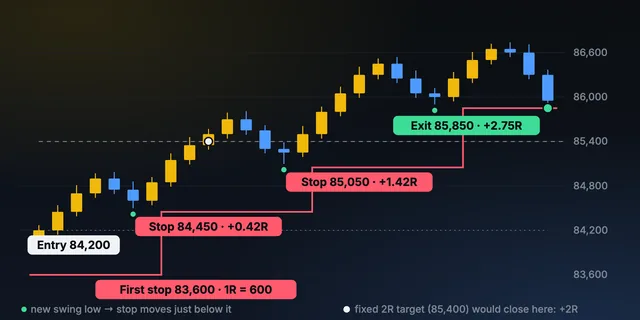
Trailing Stop Loss: How It Works, With Examples
A trailing stop loss follows the price to lock in profit while a trade runs. How it works, five ways to trail (%, ATR, swing, moving average, 1R) and examples.
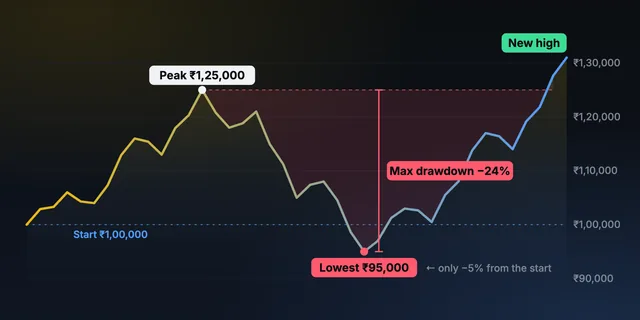
Maximum Drawdown: Meaning, Formula and Examples
Maximum drawdown is the biggest fall from a peak before a new high. Learn the formula, worked examples in ₹ and R, the recovery table and prop-firm drawdown rules.
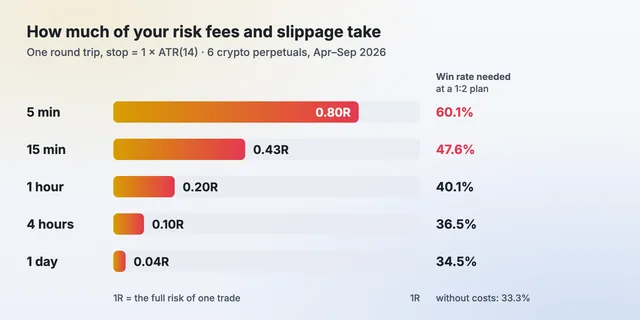
Trading Fees by Timeframe: How Much of Every 1R They Take
Original data from 6 crypto perpetuals: fees and slippage take 0.80R a trade on 5-minute charts and 0.04R on daily. See the win rate each timeframe needs.
Trading psychology
The habits that cost traders the most, how to spot them in your own trades and what to do instead.
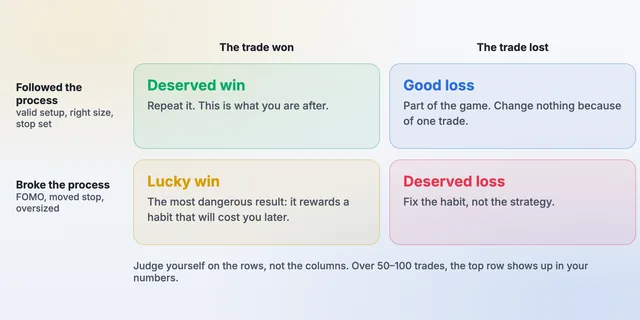
Trading Psychology: Fear, Greed, FOMO and Discipline
Trading psychology in practice: fear, greed, FOMO, revenge and overconfidence, how each shows up in your trades, and routines that keep emotions out of decisions.
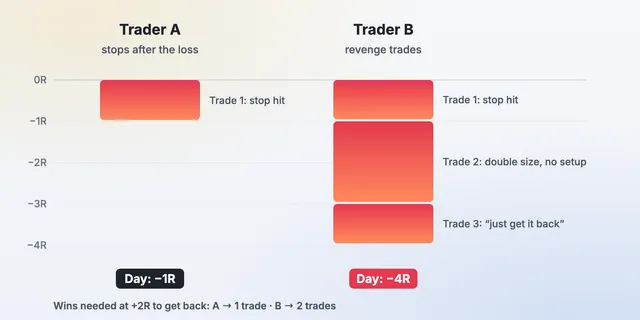
Revenge Trading: What It Is and How to Stop It
Revenge trading is jumping back in to win back a loss. Learn the warning signs, what it really costs in R, and seven rules that stop it — with examples.
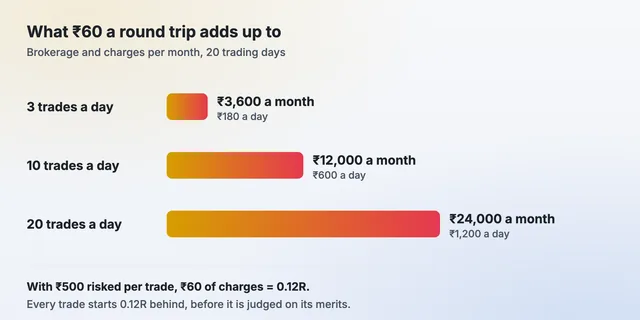
Overtrading: Meaning, Signs and How to Stop It
Overtrading means taking too many or too big trades. See the signs, what fees and extra trades cost, how to stop it — and what overtrading means in business.
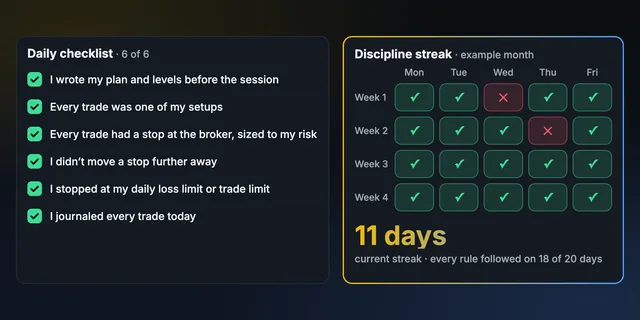
Trading Discipline: Rules, Checklist and How to Build It
Trading discipline is following your rules when it is hard. Example rules, a daily checklist, starting with three rules, and measuring discipline against results.
Planning and journaling
Write the plan before the trade and the review after it.
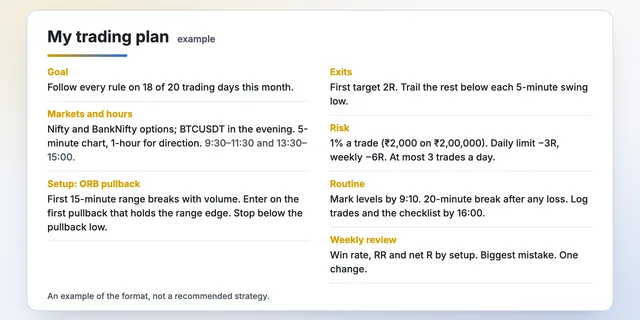
Trading Plan Template: What to Include, With an Example
A free trading plan template: markets, setups, entry and exit rules, risk per trade, daily limits, routine and review — plus a filled-in example to copy and adapt.
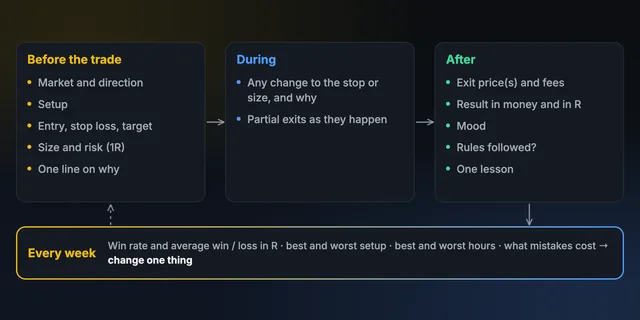
How to Journal Trades: A Step-by-Step Guide
How to journal trades properly: what to record before, during and after each trade, a weekly review routine, a worked example, common mistakes and a free template.