What does overtrading mean?
In trading, overtrading has two forms:
- Too many trades — entering setups that aren’t really your setups, trading every small move, or trading because the market is open.
- Too big trades — risking more per trade than your plan, often to “make the day count”.
Signs you are overtrading
- You take more trades per day than your plan allows — or you don’t have a number at all.
- Trades after your first two or three of the day are mostly losers.
- You trade in the quiet hours you know don’t work for you.
- Fees and charges are a noticeable share of your losses.
- You feel restless when you are not in a trade.
- A loss leads straight to another trade (see revenge trading).
What overtrading costs
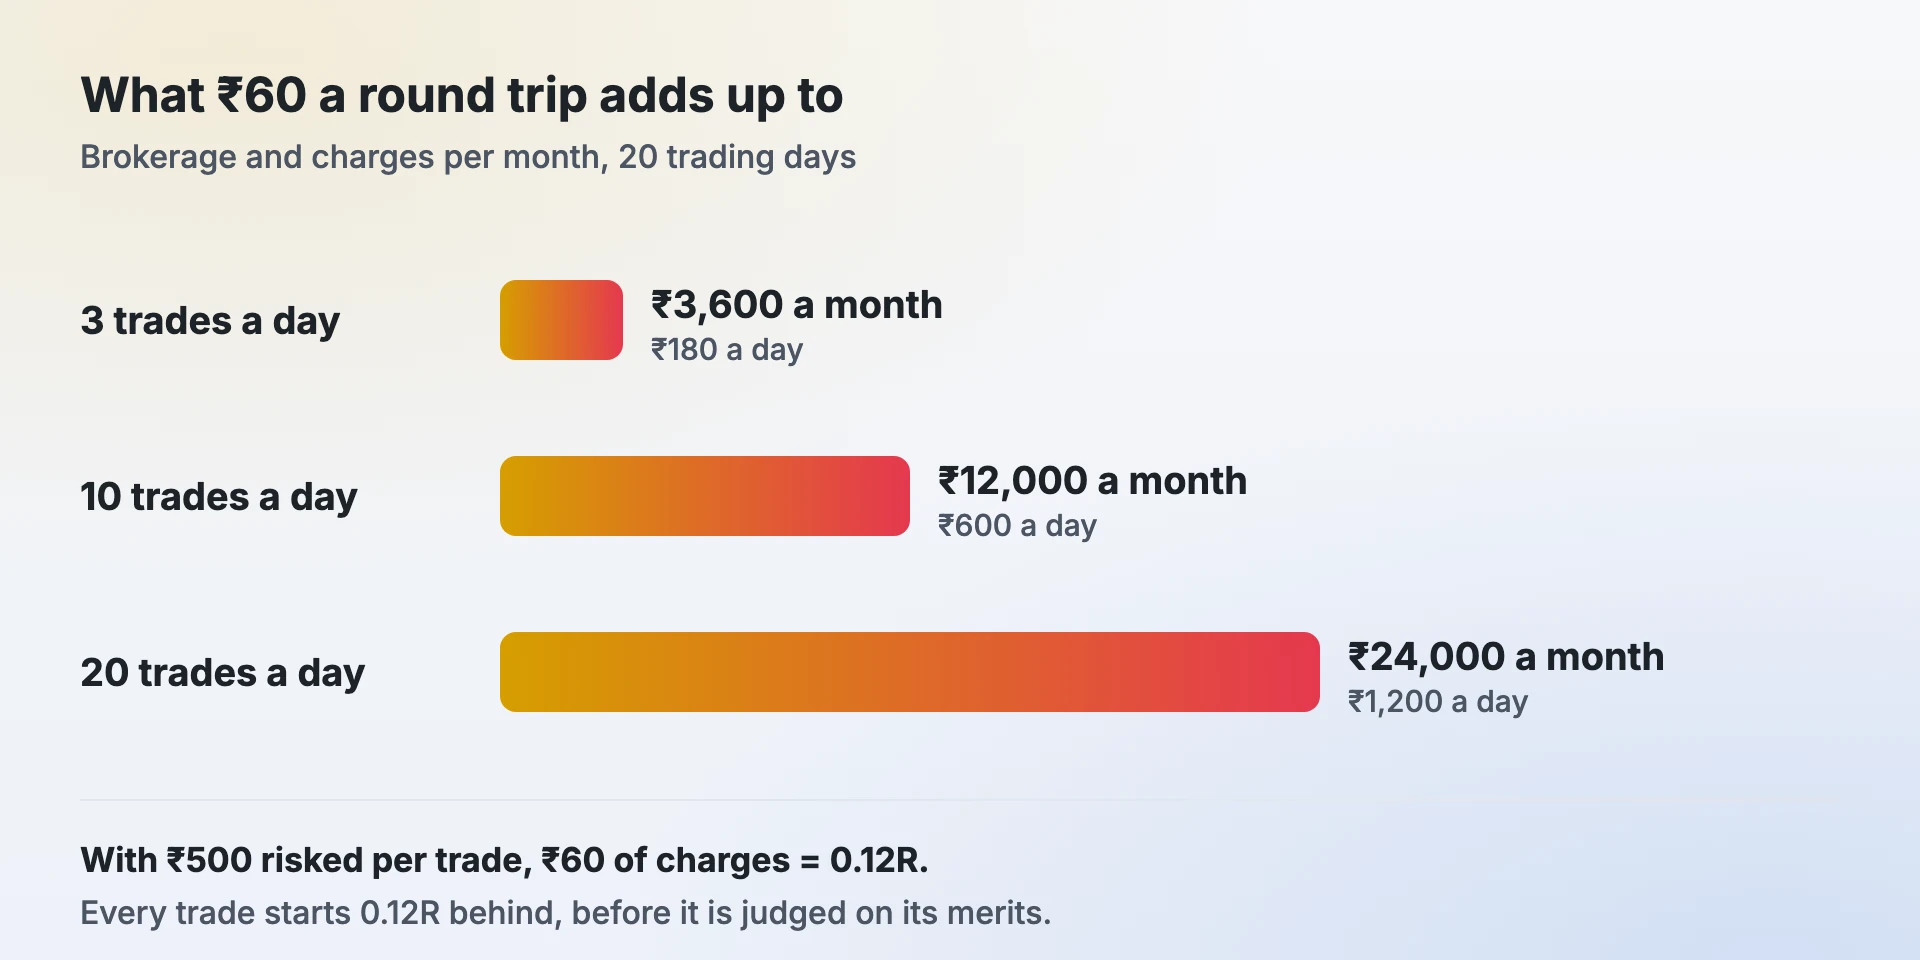
Fees add up. At ₹60 of brokerage and charges per round trip, 20 trades a day is ₹1,200 a day — about ₹24,000 a month of 20 trading days — before a single trade is judged on its merits. With ₹500 of risk per trade, each trade starts 0.12R behind.
Quality drops. Your best setups don’t appear 20 times a day. Extra trades are, on average, weaker trades. A journal usually shows it plainly: the first trades of the day have a higher win rate and average R than the fifth or sixth.
| Trades per day | Charges per day (₹60 each) | Charges per month (20 days) |
|---|---|---|
| 3 | ₹180 | ₹3,600 |
| 10 | ₹600 | ₹12,000 |
| 20 | ₹1,200 | ₹24,000 |
Why traders overtrade
- Boredom — the market is slow, so you make something happen.
- FOMO — a big move without you feels like a loss.
- A daily money target — you keep trading until you hit it.
- Recent losses — trying to get back to green.
- No written plan — without rules, every candle looks like a setup.
How to stop overtrading
- Set a maximum number of trades per day (for example 3) and a daily loss limit in R.
- Write down your A+ setups. If a trade isn’t one of them, it doesn’t exist.
- Trade a fixed window. Pick the hours where your journal shows an edge and close the platform outside them.
- Size from your stop, not your mood. Use a position size calculator so every trade risks the same 1R.
- Review by trade number. Compare your 1st–3rd trades of the day with the rest. The data usually ends the argument.
Find your own trade limit
Don’t guess the number; take it from your trades. Number each day’s trades in order (1st, 2nd, 3rd…), then group your last 50–100 trades by that number and compare the average R:
| Trade of the day | Trades | Win rate | Average R |
|---|---|---|---|
| 1st to 2nd | 48 | 52% | +0.31R |
| 3rd | 17 | 41% | +0.04R |
| 4th and later | 23 | 30% | −0.38R |
An example, not real data. In this case the limit writes itself: two trades a day, a third only for an A+ setup, and never a fourth. Check again every month, because the number can change with the market.
How a journal helps
Profit Prism Journal’s Leaks report flags groups that lose R — including “after your 3rd trade of the day” — and shows fees in R. The hour-of-day heatmap shows when you trade worst, and the daily rules checklist keeps your trade limit in front of you.
Frequently asked questions
What is overtrading in trading?
Overtrading is taking more trades, or bigger trades, than your plan and edge support — often out of boredom, FOMO, a daily money target or a recent loss.
How many trades a day is too many?
There is no single number. Too many is any trade beyond your written plan, or the point after which your own journal shows win rate and average R falling. Many discretionary traders cap themselves at two to five a day.
Is scalping the same as overtrading?
No. Scalping is a strategy with many planned trades; it becomes overtrading when trades fall outside the plan or when fees eat the edge.
What does overtrading mean in business?
In business, overtrading means growing sales faster than working capital allows, so the company runs short of cash even though it is busy.
How do I stop overtrading?
Set a maximum number of trades and a daily loss limit, trade only your written setups in a fixed time window, size every trade from your stop, and review results by trade number each week.
See your own numbers
Profit Prism Journal measures every trade in R and shows your win rate, RR, leaks and loss limits — for crypto, forex, stocks and F&O. Try it free for 7 days, no card.
Start the free trialFor education only. Not investment advice. Trading involves substantial risk of loss.