The short answer
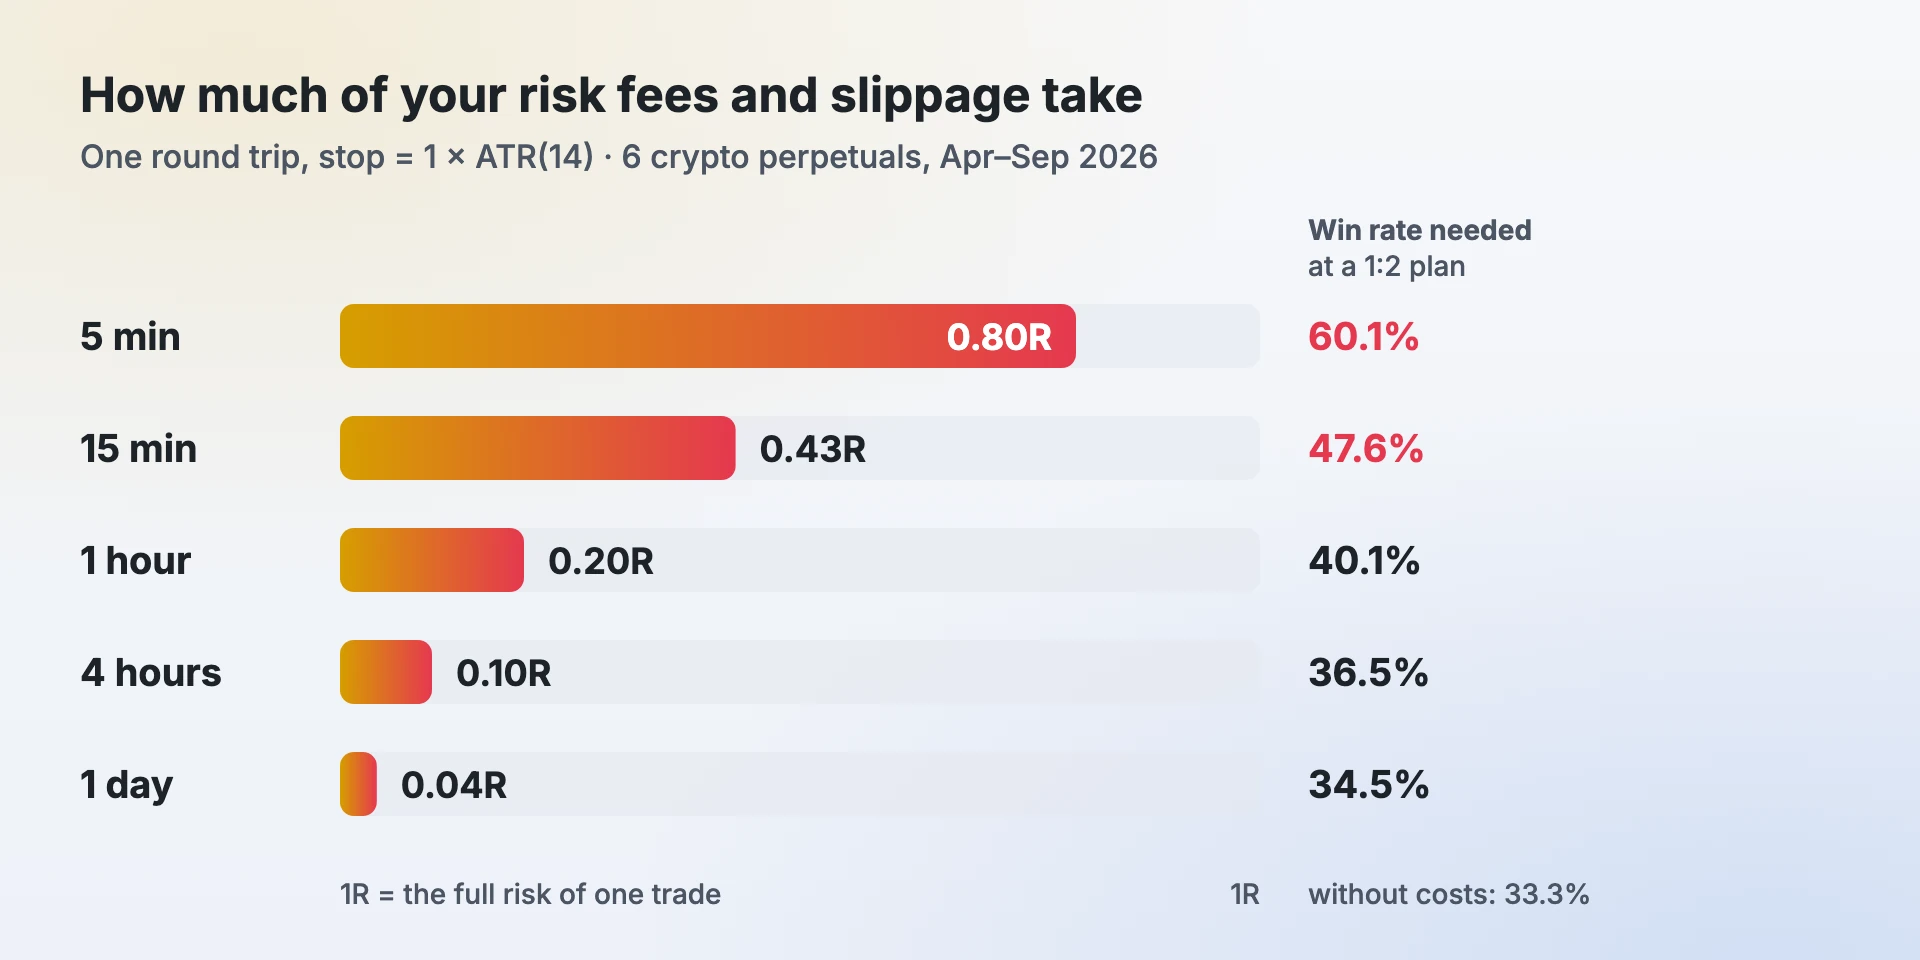
| Timeframe | Typical stop (1 × ATR) | Fees only | Fees + slippage | Win rate needed at 1:2 |
|---|---|---|---|---|
| 5 min | 0.18% of price | 0.57R | 0.80R | 60.1% |
| 15 min | 0.33% | 0.31R | 0.43R | 47.6% |
| 1 hour | 0.69% | 0.14R | 0.20R | 40.1% |
| 4 hours | 1.45% | 0.07R | 0.10R | 36.5% |
| 1 day | 3.87% | 0.03R | 0.04R | 34.5% |
Without any costs, a 1:2 plan breaks even at a 33.3% win rate. On a 5-minute chart the same plan needs 60.1%, because every trade starts 0.80R behind.
How we measured it
- Markets: BTC, ETH, SOL, XRP, BNB and DOGE USDT perpetual futures, public exchange candles from 1 April to 30 September 2026. 455,674 candles in total.
- Stop: one ATR(14), a common volatility stop. Every closed candle counts as a possible entry at its close, so no strategy is involved.
- Costs: a 0.05% taker fee on the entry and on the exit (0.10% round trip), plus 0.02% slippage on each side (0.04%). That is 0.14% of the position per trade.
- Cost in R = round-trip cost ÷ stop distance, both as a percent of price. A 0.14% cost with a 0.35% stop is 0.40R.
The table uses the median stop on each timeframe. Half the time the market is quieter than that and costs take a bigger bite: in the quietest quarter of 5-minute candles, a round trip costs more than 1.14R.
Why short timeframes cost so much
The fee is a fixed slice of the position: 0.05% of what you buy, whatever the chart. The stop is what changes. A 5-minute candle moves far less than a daily one, so the stop is tighter, the position is bigger for the same risk, and the same 0.05% becomes a much larger share of what you risk.
How often costs pass a threshold, with fees and slippage:
| Timeframe | Trades where costs pass 0.25R | Trades where costs pass 0.5R |
|---|---|---|
| 5 min | 98% | 81% |
| 15 min | 88% | 37% |
| 1 hour | 30% | 2% |
| 4 hours | 0% | 0% |
| 1 day | 0% | 0% |
Calm coins cost more, in R
A surprise in the data: Bitcoin is the most expensive coin to trade in R, because it moves the least. Its stops are tighter, so the same percentage fee is a bigger share of the risk.
| Coin | 15 min stop | 15 min costs | 1 hour stop | 1 hour costs |
|---|---|---|---|---|
| BTC | 0.25% | 0.56R | 0.54% | 0.26R |
| BNB | 0.25% | 0.55R | 0.54% | 0.26R |
| ETH | 0.34% | 0.42R | 0.73% | 0.19R |
| XRP | 0.35% | 0.40R | 0.74% | 0.19R |
| SOL | 0.39% | 0.36R | 0.84% | 0.17R |
| DOGE | 0.40% | 0.35R | 0.85% | 0.16R |
What it does to the win rate you need
With a 1:2 plan, a win pays 2R and a loss costs 1R. Costs come off both: a win nets 2R minus the cost, a loss costs 1R plus the cost. The win rate that breaks even is:
At 1:2 with 0.43R of costs (15 minutes): 1.43 ÷ 3 = 47.6%. A strategy that wins 45% of the time at 1:2 makes money on the 4-hour chart and loses on the 15-minute chart, with exactly the same entries and exits.
How to keep costs small
- Trade a higher timeframe. The single biggest lever: going from 15 minutes to 1 hour cuts costs per trade from 0.43R to 0.20R.
- Use a wider stop with a smaller size. Costs in R fall as the stop widens. Same risk, fewer coins, less fee.
- Enter with limit orders. Maker fees are lower than taker fees on most exchanges, and a limit order has no slippage. Stops still fill as market orders, so the exit stays a taker fill.
- Trade less. Every extra trade pays the full cost again. See overtrading.
- Count fees in your size. The crypto position size calculator includes fees in the risk, so a stop-out costs what you planned and not more.
Track your own costs
Your numbers will differ from these medians: your exchange tier, your stop rule and how often you trade all change them. Log fees on every trade. In Profit Prism Journal the result of each trade is shown after fees, in money and in R, and the Leaks report shows how much R fees took over the month, next to your other leaks.
Using this data
You are welcome to quote these numbers or use the chart in an article, a video or a course. Please credit “Profit Prism” with a link to this page. For the full data or a version for another exchange, write to hello@profitprismx.com.
This is a study of trading costs, not a trading system or advice. Past volatility does not predict future volatility.
Frequently asked questions
How much do trading fees cost per trade?
It depends on your stop more than on the fee. With a 0.05% taker fee each way plus 0.02% slippage each way and a stop of one ATR(14), a round trip costs about 0.80R on 5-minute crypto charts, 0.43R on 15-minute, 0.20R on 1-hour, 0.10R on 4-hour and 0.04R on daily charts.
Why are fees so high for scalping?
The fee is a fixed share of the position, but scalpers use tight stops. A tight stop means a big position for the same risk, so the same 0.05% fee becomes a large share of what is risked on the trade.
What win rate do I need after fees?
Break-even win rate = (1 + cost in R) ÷ (reward:risk + 1). At a 1:2 plan that is 33.3% with no costs, about 40% on 1-hour crypto charts and about 48% on 15-minute charts.
Do maker orders help?
Yes. Maker fees are lower than taker fees on most exchanges and a limit entry has no slippage. Stop-losses still fill as market orders, so at least the exit pays the taker fee.
Does the same apply to Indian F&O and forex?
The idea is the same: costs per trade divided by the risk per trade. Indian option buyers pay a fixed brokerage plus taxes per order, and forex traders pay the spread. Divide your real round-trip cost by your risk to get your number in R.
See your own numbers
Profit Prism Journal measures every trade in R and shows your win rate, RR, leaks and loss limits — for crypto, forex, stocks and F&O. Try it free for 7 days, no card.
Start the free trialFor education only. Not investment advice. Trading involves substantial risk of loss.