What SMC is, and where it comes from
SMC grew out of the teaching of Michael Huddleston, known as ICT (Inner Circle Trader), and spread through YouTube and Telegram. Most of its ideas are older price action ideas with new names: support and resistance, stop runs, supply and demand zones, and trend structure.
The “smart money” in the name means banks, funds and other large traders. The story is that they can’t buy or sell size at one price without moving the market, so they push price into areas full of other traders’ orders and fill there. Nobody outside can see who is behind a move, so treat this as a model for reading charts, not a fact about who is trading.
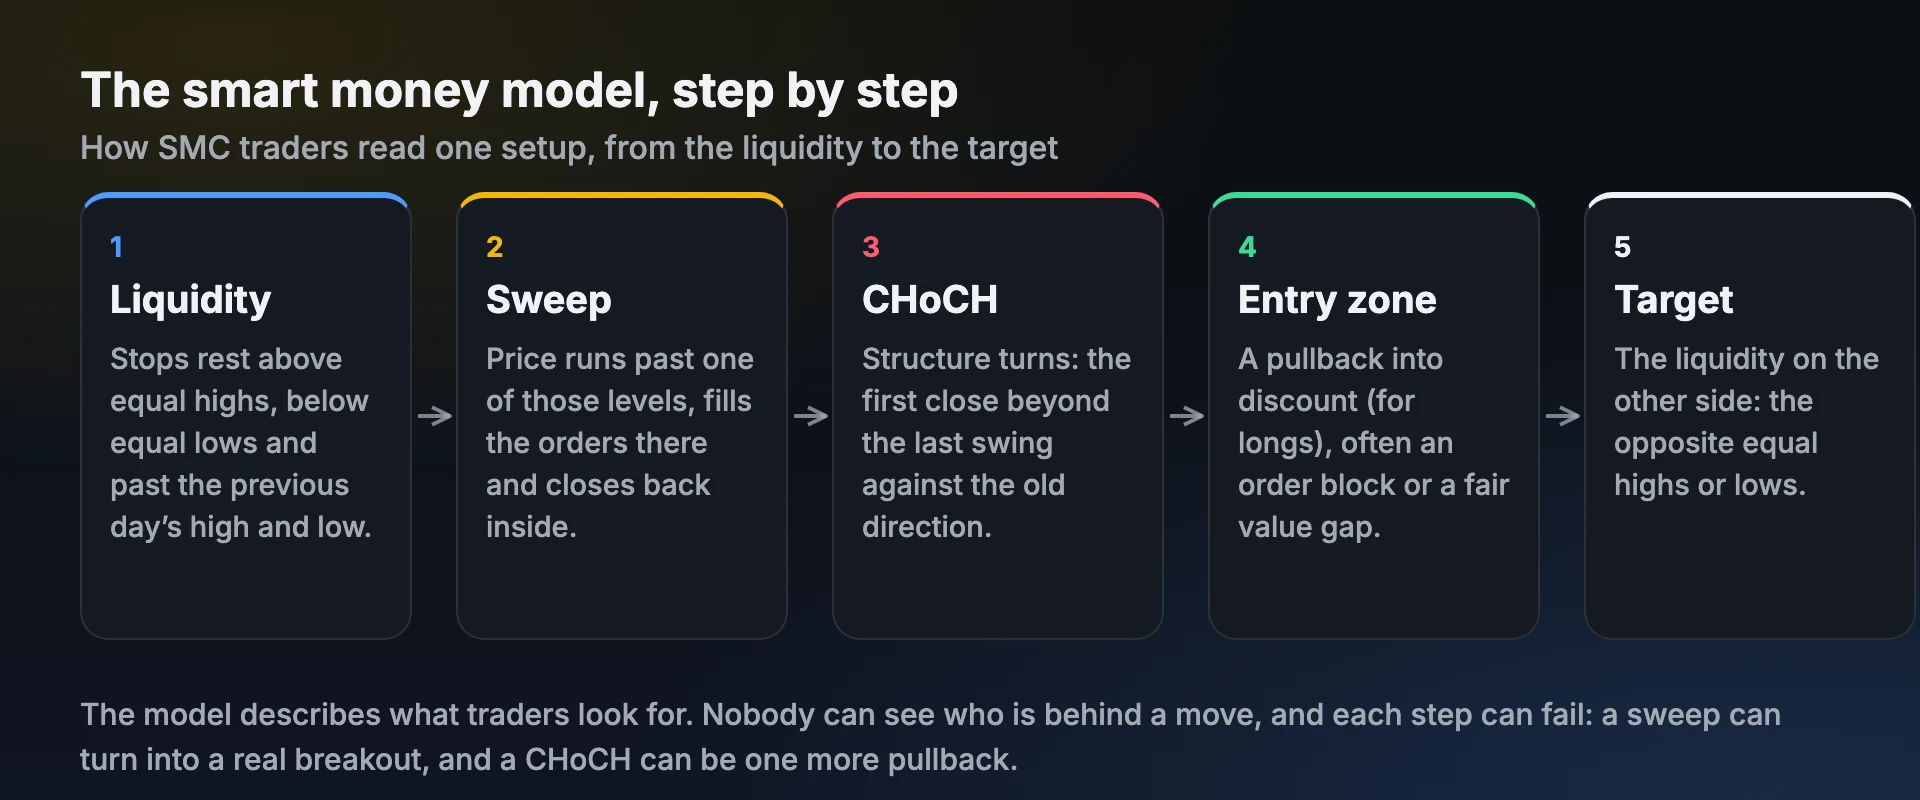
The building blocks
| Term | What it means | Guide |
|---|---|---|
| Market structure | The pattern of swing highs and lows: higher highs and higher lows in an uptrend, lower highs and lower lows in a downtrend | BOS vs CHoCH |
| BOS | Break of structure: a close beyond the last swing in the trend’s direction. The trend continues. | BOS vs CHoCH |
| CHoCH | Change of character: the first close beyond the last swing against the trend. It may be turning. | BOS vs CHoCH |
| Liquidity | Resting orders, mostly stops, above highs (buy-side) and below lows (sell-side) | Liquidity sweep |
| Liquidity sweep | A run past a high or low that closes back inside, taking the stops there | Liquidity sweep |
| Order block (OB) | The last opposite-coloured candle before a strong move that broke structure. Traders expect price to react when it returns there. | |
| Fair value gap (FVG) | A gap in a three-candle move where the first candle’s high and the third candle’s low don’t overlap (in a rally). Traders expect price to come back and fill part of it. | |
| Premium and discount | The top and bottom halves of a range, split at 50%. Buy in discount, sell in premium. | Premium and discount |
| Inducement | A small, obvious high or low near a zone that draws early traders in before the real move |
How smart money “traps” retail traders
This is the part of SMC most people find useful, whatever they think of the rest. The traps it describes are real patterns any trader can check on a chart:
- Stops at obvious levels. A stop just under equal lows or yesterday’s low is easy to find. Price often runs those levels before turning. Put stops beyond structure with a buffer, and size down.
- Buying the first breakout. A poke above a range high that closes back inside traps the breakout buyers. Wait for a close and a hold.
- Chasing in premium. Buying near the top of a move after a big candle means a wide stop or a poor reward. Wait for a pullback, or skip it.
- Entering before confirmation. Buying a falling market “because it’s at support” without any change in structure.
We tested four SMC setups: the results
We turned four common SMC setups into fixed rules and ran them on six years of public candles for six USDT perpetual futures, with exchange fees, slippage and funding included. We chose the rules on BTC, ETH and SOL, then checked them on XRP, BNB and DOGE, which we never looked at while choosing. A rule that only works on the markets it was tuned on is usually fitted to the past, not a real edge.
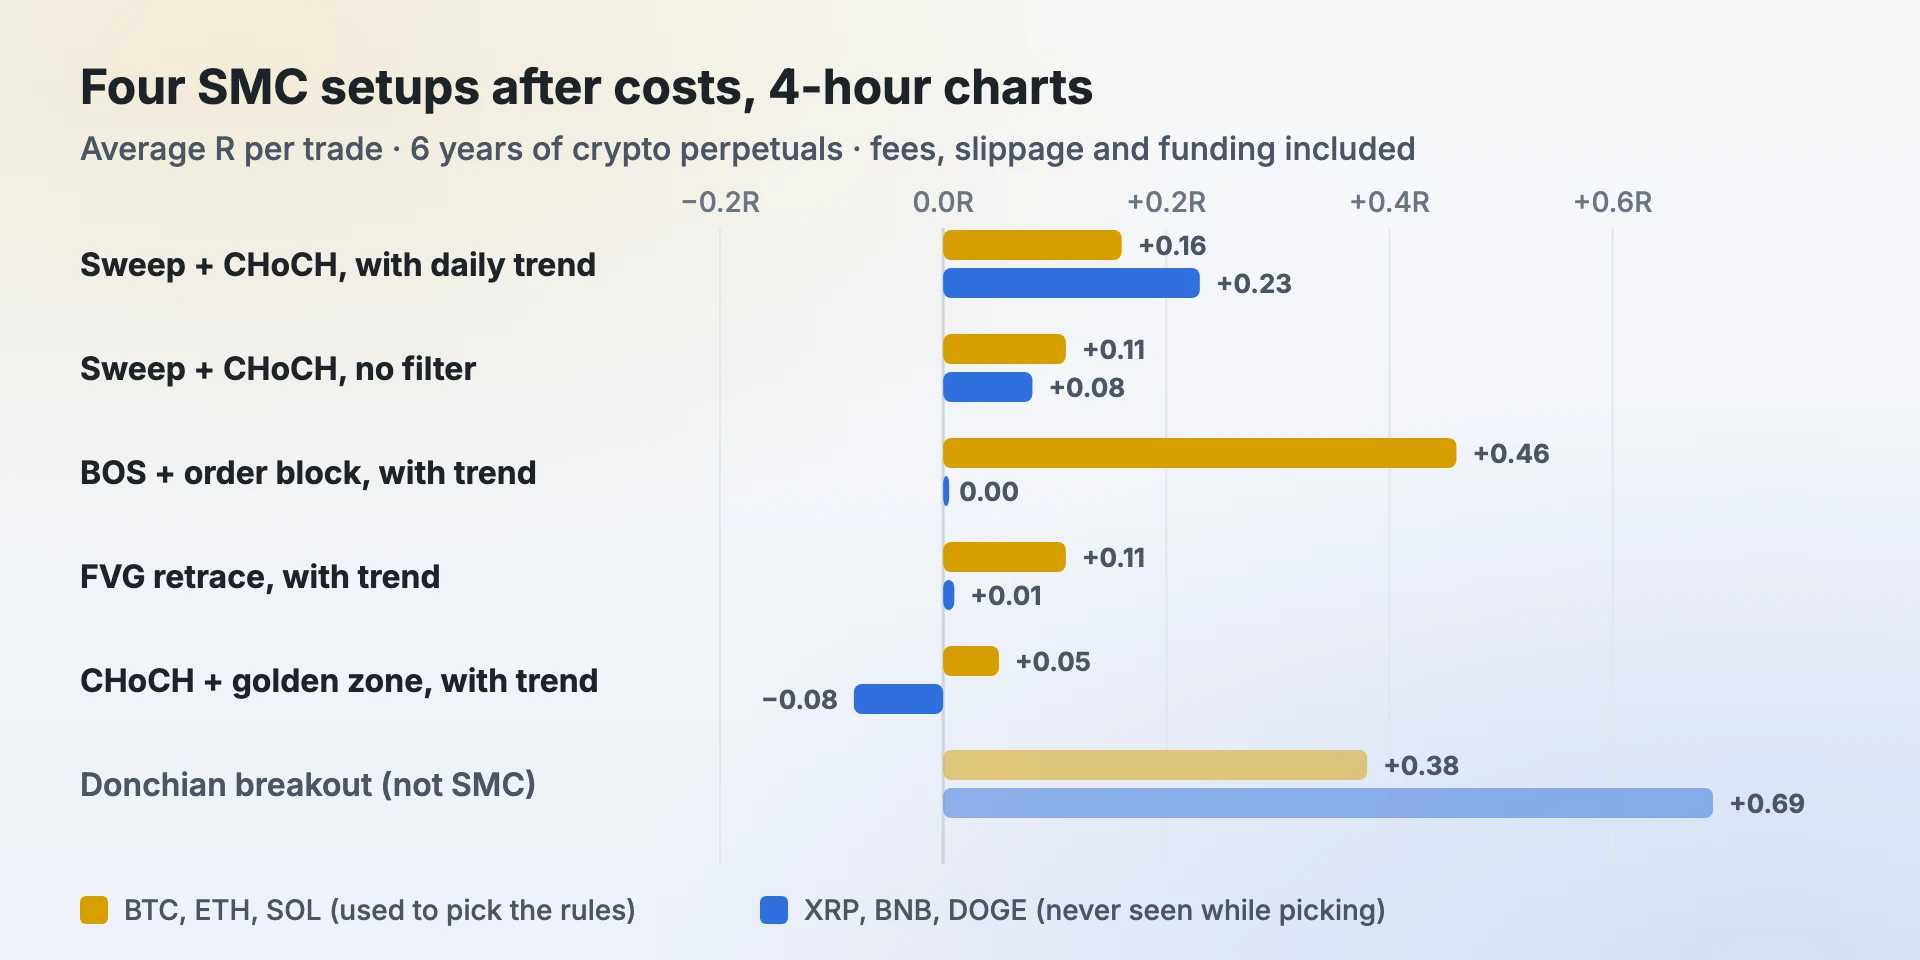
Average R per trade after all costs. Each cell shows BTC, ETH, SOL | XRP, BNB, DOGE.
| Setup | 15 min | 1 hour | 4 hours |
|---|---|---|---|
| Sweep + CHoCH, with the daily trend | −0.08 | −0.11 | +0.03 | −0.03 | +0.16 | +0.23 |
| Sweep + CHoCH, no filter | −0.08 | −0.10 | −0.01 | −0.15 | +0.11 | +0.08 |
| BOS + order block, with the trend | −0.12 | −0.16 | +0.07 | +0.03 | +0.46 | 0.00 |
| FVG retrace, with the trend | −0.13 | −0.15 | +0.02 | +0.03 | +0.11 | +0.01 |
| CHoCH + golden zone (0.618), with the trend | −0.12 | −0.11 | −0.12 | −0.04 | +0.05 | −0.08 |
| Donchian breakout, for comparison (not SMC) | −0.04* | +0.17 | +0.22 | +0.38 | +0.69 |
* Only one 15-minute figure was recorded for the breakout. The setups exit with a stop that trails price once the trade is 1R in profit; a fixed 2R target did worse almost everywhere.
What we learned
- Short timeframes lose after costs. Every setup lost on 15-minute charts, even with limit-order entries. Order block and FVG stops are small, so fees and stop slippage take a large share of each trade. See trading fees by timeframe.
- On 1-hour charts SMC was close to zero.
- Only one setup was positive on both sets of markets on 4-hour charts: a liquidity sweep followed by a CHoCH, taken only in the direction of the daily trend. On BTC, ETH and SOL its results faded to about zero after 2024, so even this one is a weak edge.
- The best-looking result was the least real. BOS + order block made +0.46R a trade on the markets used to pick it and nothing on the other three. It fitted the past of those three markets, not the market.
- The daily trend filter helped, as it does for most strategies.
- A plain trend-following breakout did better than all four. We include it so the SMC numbers have something to be compared with.
These are our versions of the rules. Your definitions of a swing, an order block or a sweep may differ, and small differences change results. That is the point: write your rules down and test them the same way before trusting them with money.
How we tested
- Data: six years of public candles for BTC, ETH, SOL, XRP, BNB and DOGE USDT perpetual futures, on 15-minute, 1-hour and 4-hour charts.
- Sweep + CHoCH: price takes the last swing low (or high), closes back inside, then structure turns with a CHoCH; entry on that close, stop beyond the sweep.
- BOS + order block: after a BOS in the trend’s direction, a limit order at the last opposite candle before the move; stop beyond the block.
- FVG retrace: after a strong candle leaves a fair value gap in the trend’s direction, a limit order in the gap; stop beyond the gap.
- CHoCH + golden zone: after a CHoCH, a limit order at the 0.618 retracement of the leg.
- Daily trend filter: trade only in the direction of the daily trend (daily close above the 50-day EMA and the 20-day EMA above the 50-day EMA for longs, the opposite for shorts).
- Costs: taker fees on market orders and stops, maker fees on limit entries, slippage on market fills, and funding while a trade is open.
How to test your own SMC rules
- Write the rules so another trader could follow them. What counts as a swing, a sweep, a CHoCH, an order block. Where the stop goes. Where you exit.
- Pick one timeframe and one market group and stick to them for the test.
- Log every trade, including the ones you skip, with the setup as a tag and fees included.
- Judge it in R after 50 to 100 trades, not after five good ones. Average R per trade after costs is the number that matters.
- Check it on a market you didn’t use to build it.
Profit Prism Journal is built for exactly this: tag each trade with its setup and the app shows win rate, average R, net R and the money each setup made or lost, after fees, so you can see which part of SMC is working for you.
Using this data
You are welcome to quote these results or use the chart, with credit to “Profit Prism” and a link to this page. Questions about the method: hello@profitprismx.com.
For education only. Not investment advice. Past results do not predict future results, and these are tests of our versions of the rules, not a recommendation to trade them.
Frequently asked questions
What are smart money concepts in trading?
Smart money concepts (SMC) are a way of reading price action that focuses on market structure, liquidity (resting stop orders above highs and below lows), liquidity sweeps, order blocks, fair value gaps and premium and discount zones. The idea is that large traders need those orders to fill their positions.
Who created smart money concepts?
SMC grew out of the teaching of Michael Huddleston, known as ICT (Inner Circle Trader). Many of its ideas are older price action ideas, such as support and resistance and stop runs, with new names.
Does SMC trading actually work?
In our test of four SMC setups on six years of crypto perpetual futures, after fees, slippage and funding, every setup lost on 15-minute charts and was close to zero on 1-hour charts. Only a liquidity sweep plus CHoCH taken with the daily trend was positive on both market sets on 4-hour charts, and its edge was small.
What is the difference between an order block and a fair value gap?
An order block is the last opposite-coloured candle before a strong move that broke structure. A fair value gap is the gap inside a three-candle move where the first and third candles don’t overlap. Both are areas where SMC traders expect price to react when it returns.
Which timeframe is best for SMC?
In our tests, higher timeframes did better: costs take a much smaller share of each trade on 4-hour charts than on 15-minute charts, where every SMC setup we tested lost after costs.
Is SMC different from price action trading?
SMC is a style of price action trading. It uses the same candles, highs and lows, with its own names and a focus on where stop orders sit.
See your own numbers
Profit Prism Journal measures every trade in R and shows your win rate, RR, leaks and loss limits — for crypto, forex, stocks and F&O. Try it free for 7 days, no card.
Start the free trialFor education only. Not investment advice. Trading involves substantial risk of loss.