The short answer
| Zone | Where | In an uptrend | In a downtrend |
|---|---|---|---|
| Premium | Above 50% of the range | Take profit, don’t chase | Look for shorts |
| Equilibrium | The 50% line | Fair middle | Fair middle |
| Discount | Below 50% of the range | Look for longs | Take profit, don’t chase |
How to draw the range
- Find the leg that made the last break of structure. In an uptrend, that is the move from the swing low to the high that made the latest BOS.
- Draw a Fibonacci tool from the low to the high (in an uptrend). Most charting tools let you add a 0.5 level; that line is equilibrium.
- Everything above 0.5 is premium, everything below is discount.
- Redraw after each new BOS. A new high makes a new leg and a new range.
In a downtrend, draw from the swing high to the swing low. Then the top half is premium, where shorts look to sell.
Worked examples
| BTCUSDT, uptrend | NIFTY, uptrend | NIFTY, downtrend | |
|---|---|---|---|
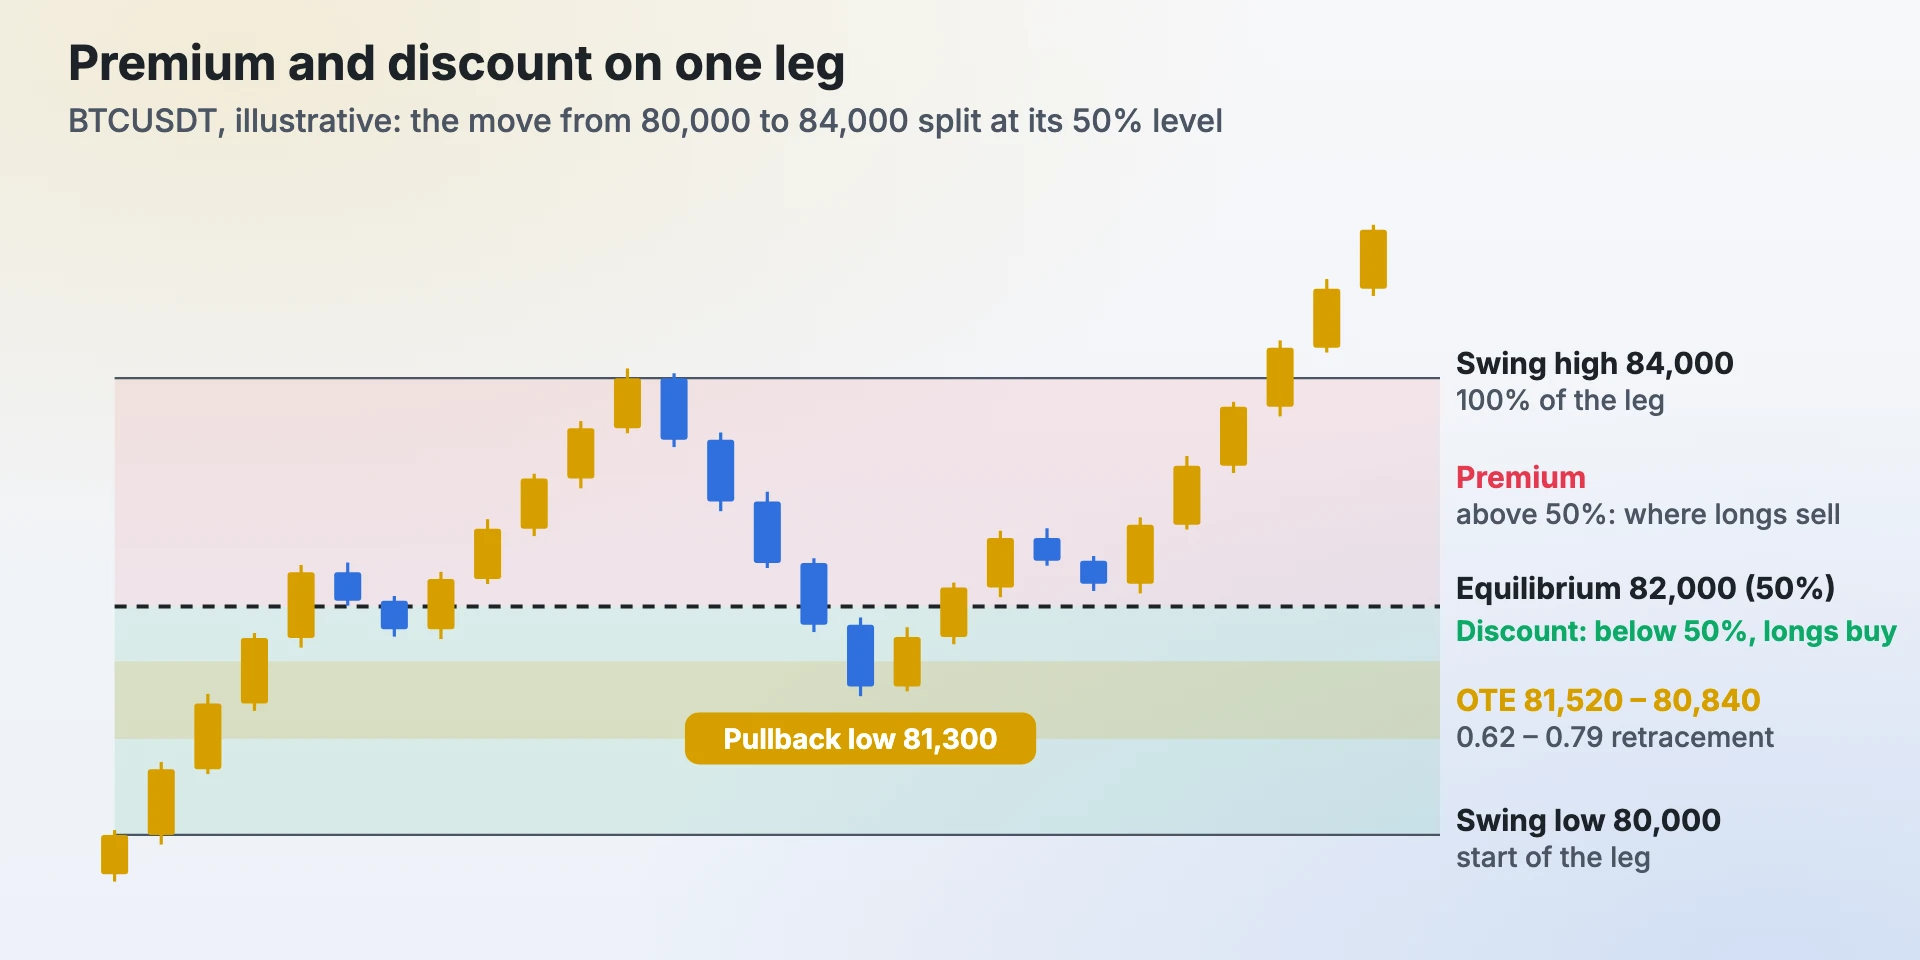
| Leg | 80,000 → 84,000 | 24,000 → 24,600 | 24,600 → 24,000 |
| Equilibrium (50%) | 82,000 | 24,300 | 24,300 |
| Trade zone | Discount: below 82,000 | Discount: below 24,300 | Premium: above 24,300 |
| OTE (0.62 – 0.79) | 81,520 – 80,840 | 24,228 – 24,126 | 24,372 – 24,474 |
BTC: 84,000 − 0.62 × 4,000 = 81,520 · 84,000 − 0.79 × 4,000 = 80,840
Level in a downtrend = low + retracement × (high − low)
NIFTY: 24,000 + 0.62 × 600 = 24,372 · 24,000 + 0.79 × 600 = 24,474
The OTE zone
OTE (optimal trade entry) is a narrower part of the discount zone, between the 0.62 and 0.79 retracement of the leg. Many SMC traders place limit orders there, often at 0.705, with a stop beyond the start of the leg. The appeal is the price: buying deep in the range keeps the stop close to the entry relative to the target at the old high or beyond.
The catch is that strong trends often don’t pull back that far. If you only buy at OTE, you miss those moves completely.
What the data says
We tested one popular version on six years of crypto perpetuals: a CHoCH, then a limit entry in the 0.618 golden zone, with fees and slippage included. It did not show an edge. Before costs it was close to zero on every timeframe, and after costs it lost a little almost everywhere. Two reasons stood out in the data:
- The best moves never came back. Strong trends often don’t retrace to 0.618, so the limit order never fills and the biggest winners are missed.
- Deep pullbacks were often a warning. When price did fall far into discount, the move was more often failing than resting, so many filled trades kept falling.
Discount tells you where a long is cheaper, not whether to buy. Use it as a location, together with structure and liquidity, not as a signal on its own. Full results in the SMC test data.
Common mistakes
- Drawing the range on the wrong leg. Use the leg that made the latest break of structure on your trading timeframe, not any high and low on the screen.
- Buying discount in a downtrend. In a downtrend, discount is where shorts take profit, not where longs are safe.
- Treating the zone as support. Price can go straight through discount and break the leg’s low.
- Waiting for OTE in a strong trend. Have a rule for what you do if the pullback is shallow, even if the rule is “no trade”.
- Ignoring the risk. A long at the bottom of discount with a stop below the leg low is still a trade that can lose 1R. Size it from the stop.
Measure it on your own trades
Note on each trade whether you entered in premium, at equilibrium or in discount, for example as tags. After a few dozen trades, compare win rate and average R by zone in Profit Prism Journal. It is the quickest way to find out if waiting for discount helps you or just makes you miss trades.
For education only. Not investment advice. Chart examples are illustrative.
Frequently asked questions
What are premium and discount zones?
They are the top and bottom halves of a price range drawn from a swing low to a swing high. Above the 50% level is premium, below it is discount. In an uptrend traders look to buy in discount; in a downtrend they look to sell in premium.
How do you find the equilibrium level?
Equilibrium is the 50% level of the range: (swing high + swing low) ÷ 2. For a leg from 80,000 to 84,000 it is 82,000.
What is the OTE zone?
OTE (optimal trade entry) is the area between the 0.62 and 0.79 retracement of the leg, inside the discount zone in an uptrend. For a leg from 80,000 to 84,000 it runs from 81,520 down to 80,840.
Which range should I use for premium and discount?
The leg that made the latest break of structure on the timeframe you trade, from its swing low to its swing high in an uptrend. Redraw it after each new break of structure.
Is buying in discount a strategy on its own?
Not in our tests. A CHoCH with a limit entry in the 0.618 zone was close to zero before costs and slightly negative after them on six years of crypto data. Discount is a location to combine with structure and liquidity, not a signal on its own.
See your own numbers
Profit Prism Journal measures every trade in R and shows your win rate, RR, leaks and loss limits — for crypto, forex, stocks and F&O. Try it free for 7 days, no card.
Start the free trialFor education only. Not investment advice. Trading involves substantial risk of loss.