Your whole month on one screen
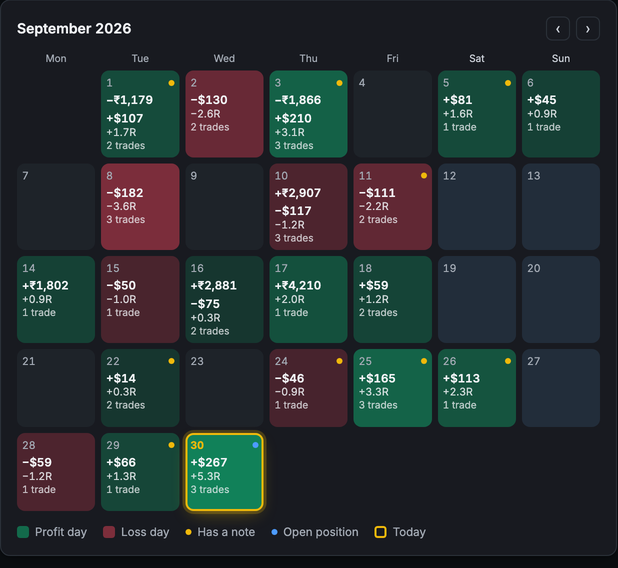
This is the real Journal page, opened on a demo account: your numbers at the top, every trade with its result in money and in R, open positions and the month as a calendar.

Demo account, demo trades.
A trading journal app that works out your win rate, risk:reward and R for every strategy, and keeps a streak of the days you followed your own rules. Made for traders who review their trades. What do these mean? →
This is the real Journal page, opened on a demo account: your numbers at the top, every trade with its result in money and in R, open positions and the month as a calendar.
Demo account, demo trades.
Write your own daily rules and tick them off each day. A compliance percentage and a calendar heatmap turn "I got sloppy that week" into a number you can point at.
Each day shows its result in money and in R, the number of trades, and a dot when you wrote a note. Click a day to see its trades next to your note, and flip back through any month.
Partial exits, averaging in, fees, a screenshot of the setup, and strike, CE/PE and expiry for options. Log the trade the way it happened.
Set a daily and weekly loss limit in R, the same unit as everything else here, and see how much of it you've used. The position calculator sizes each trade to your risk before you enter.
Smaller features you'll use every week.
Tag each trade with how you felt, such as Confident, FOMO or Revenge, and see what each mood does to your results.
Keep one portfolio per broker or account, so options, spot and swing trades can be reviewed apart.
Bring in your trade history, or take your data with you any time. It's yours either way.
Nine sample trades, seeded automatically, so every chart and filter has something real to show you immediately.
Whichever you trade in. Switches instantly, remembers your choice next time you log in.
Collapse it to icons when you want more room for the page.
Short findings from your own trades: your best market, a losing strategy, the mood that costs you. Each needs at least 3 trades behind it.
Trades, win rate, average and net R for longs and for shorts, so you know which side works for you.
Net R month by month, and how far your trades run: how many stop at −1R and how many reach 2R or more.
The habits that cost you, such as a mood, an hour, trading after a loss, losses past 1R or fees, ranked by R lost, with the trades behind each.
₹, $, €, £, ¥, USDT and more, each kept separate, with R putting them on one curve.
Save each broker's charges once and fees fill in by themselves; scale into a trade over several entries and the average is worked out for you.
7 days free, no card. Demo trades are already in your journal, so you can look around before you log your own.
Or get 1 quarter free by opening an account with a partner broker or exchange.
New to journaling? Read how to journal trades, or start with the free trading journal template.