Why journal your trades
- Memory lies. You remember the big wins and the painful losses, not the slow leaks.
- Numbers settle arguments. Win rate, risk:reward and R per setup show what actually works.
- Writing slows you down. Having to write a reason before entering filters out impulse trades.
What to record for every trade
| When | Record |
|---|---|
| Before the trade | Market and direction, setup, entry, stop loss, target, size and risk (1R), and one line on why |
| During | Any change to the stop or size, and why — partial exits as they happen |
| After | Exit price(s), fees, result in money and in R, mood, whether you followed your rules, and one lesson |
| Optional | A chart screenshot, the time, the session, the news around it |
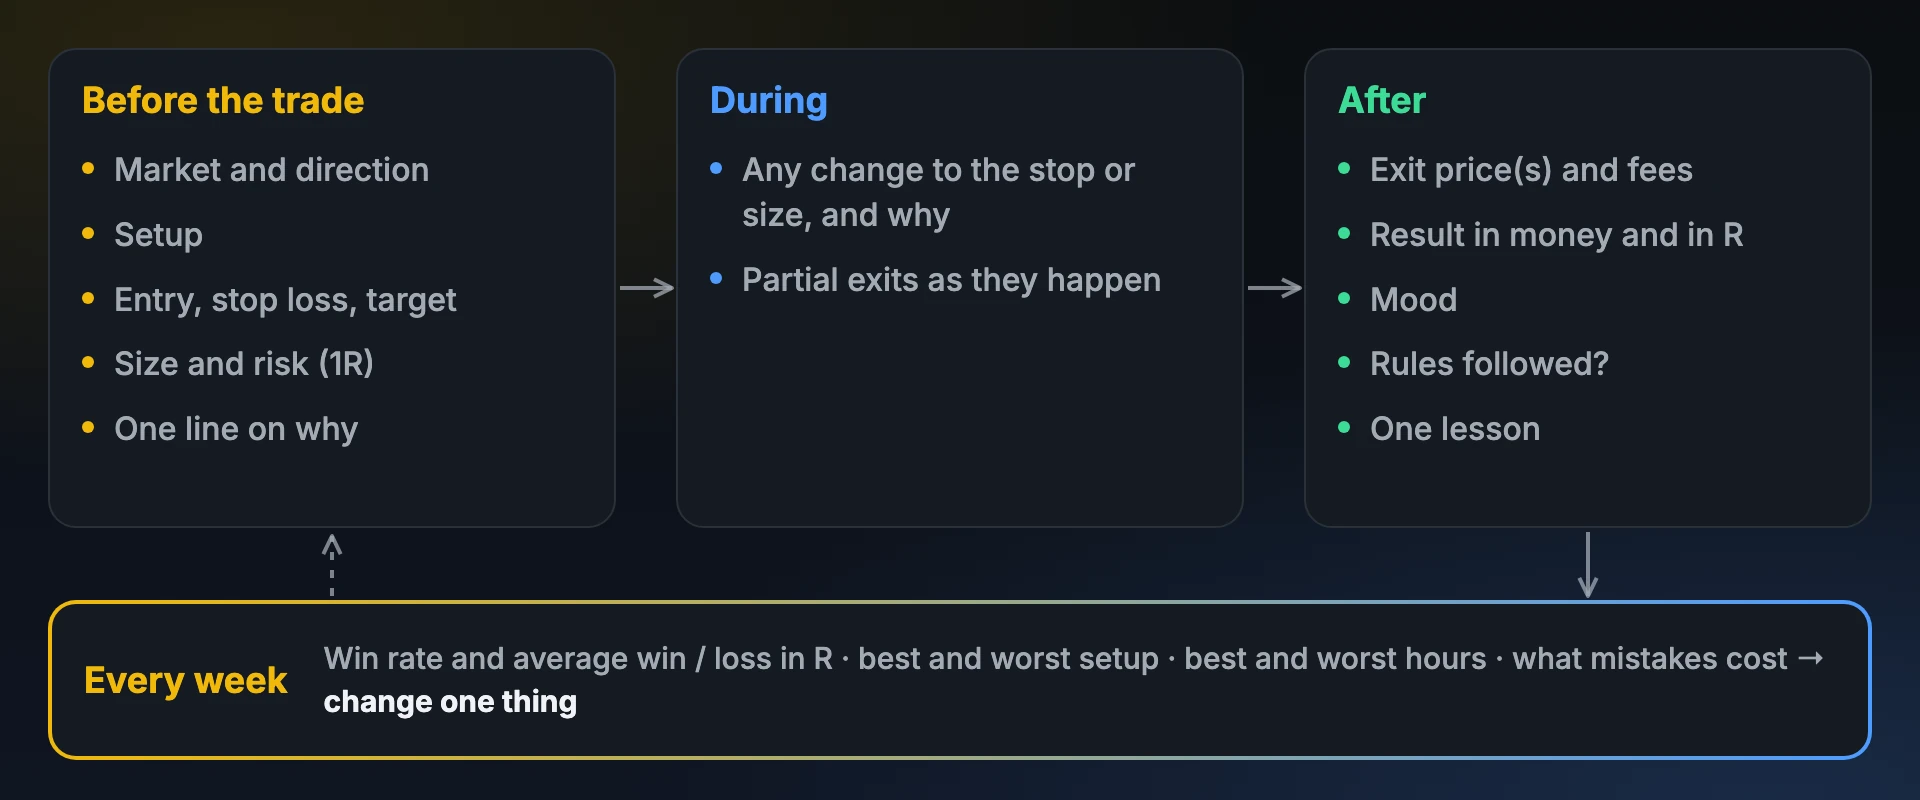
How to journal trades, step by step
- Choose your tool. A notebook works, but a spreadsheet or a journal app does the maths. Start with our free template if you like spreadsheets.
- Define 1R. Before each trade, write the stop and size so the loss at the stop is your planned risk. Without a stop there is no R.
- Log the plan before you click. Setup, entry, stop, target, reason. One line is enough.
- Log the result the same day. Exit, fees, result in R, mood, rules followed, one lesson.
- Review every week. Use the questions below.
- Change one thing at a time. Drop a losing setup, cut a bad hour, or fix one habit — then measure again.
A filled-in example
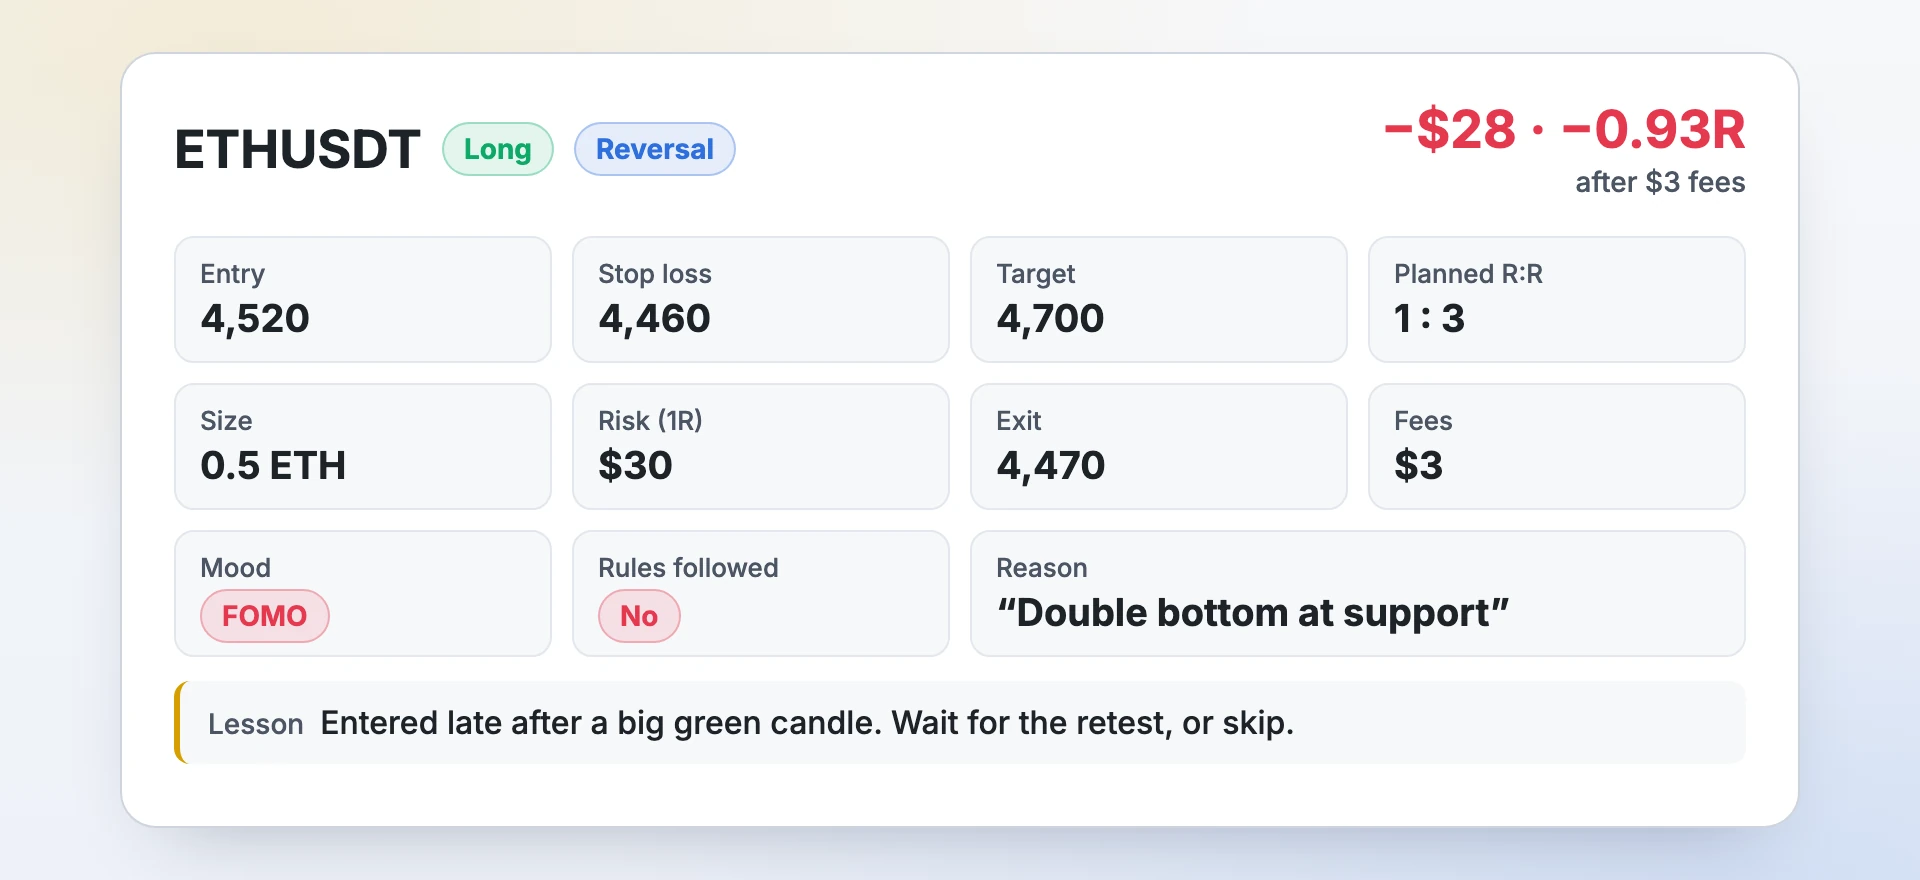
One trade like this means little. Twenty of them tagged “FOMO” with an average of −0.7R is a clear message.
Weekly review questions
- What were my win rate, average win and average loss in R, and my net R?
- Which setup earned the most R? Which lost the most?
- Which hours and days were best and worst?
- What did my mistakes cost (moved stops, early exits, revenge trades)?
- Did I follow my daily loss limit and trade limit every day?
- What is the one change for next week?
How long it takes
Less than most people expect. About one minute before the trade (plan and reason), one or two minutes after it (exit, fees, mood, rules, lesson), and 20–30 minutes once a week for the review. For 3 trades a day that is roughly 10 minutes a day and half an hour on the weekend. If logging takes longer than that, the tool is too slow; a template or an app with saved defaults fixes it.
Common journaling mistakes
- Logging only some trades — usually the good ones.
- No stop recorded, so no R and no fair comparison.
- Judging trades by money instead of by R and by whether you followed the plan.
- Never reviewing — a journal nobody reads is a diary.
- Changing everything after one bad week.
Notebook, spreadsheet or app?
Notebook
Free and personal, good for notes and emotions. No statistics unless you calculate them yourself.
Spreadsheet
Free, flexible, does the maths with formulas. You maintain it, and charts take work. Get our template.
Journal app
Fast entry, automatic stats, calendar and reports. Profit Prism Journal measures every trade in R and shows what to fix.
Frequently asked questions
How do I start a trading journal?
Pick a tool (notebook, spreadsheet or app), decide your risk per trade (1R), and for every trade record the setup, entry, stop, target, size, exit, fees, result in R, mood and one lesson. Review it every week.
What should I write in a trading journal?
The plan (market, direction, setup, entry, stop, target, size, reason), what changed during the trade, and the result (exit, fees, money and R, mood, rules followed, lesson). A screenshot helps.
How often should I review my trading journal?
Briefly at the end of each trading day and properly once a week, with a deeper monthly look at setups, hours and habits.
Should I journal losing trades?
Yes — every trade. Losing trades are where most of the lessons are, and leaving them out makes every statistic wrong.
Is a spreadsheet or an app better for journaling?
Both work. A spreadsheet is free and flexible but you maintain it; an app is faster and gives charts and reports automatically. The best one is the one you will use every day.
See your own numbers
Profit Prism Journal measures every trade in R and shows your win rate, RR, leaks and loss limits — for crypto, forex, stocks and F&O. Try it free for 7 days, no card.
Start the free trialFor education only. Not investment advice. Trading involves substantial risk of loss.