The short answer
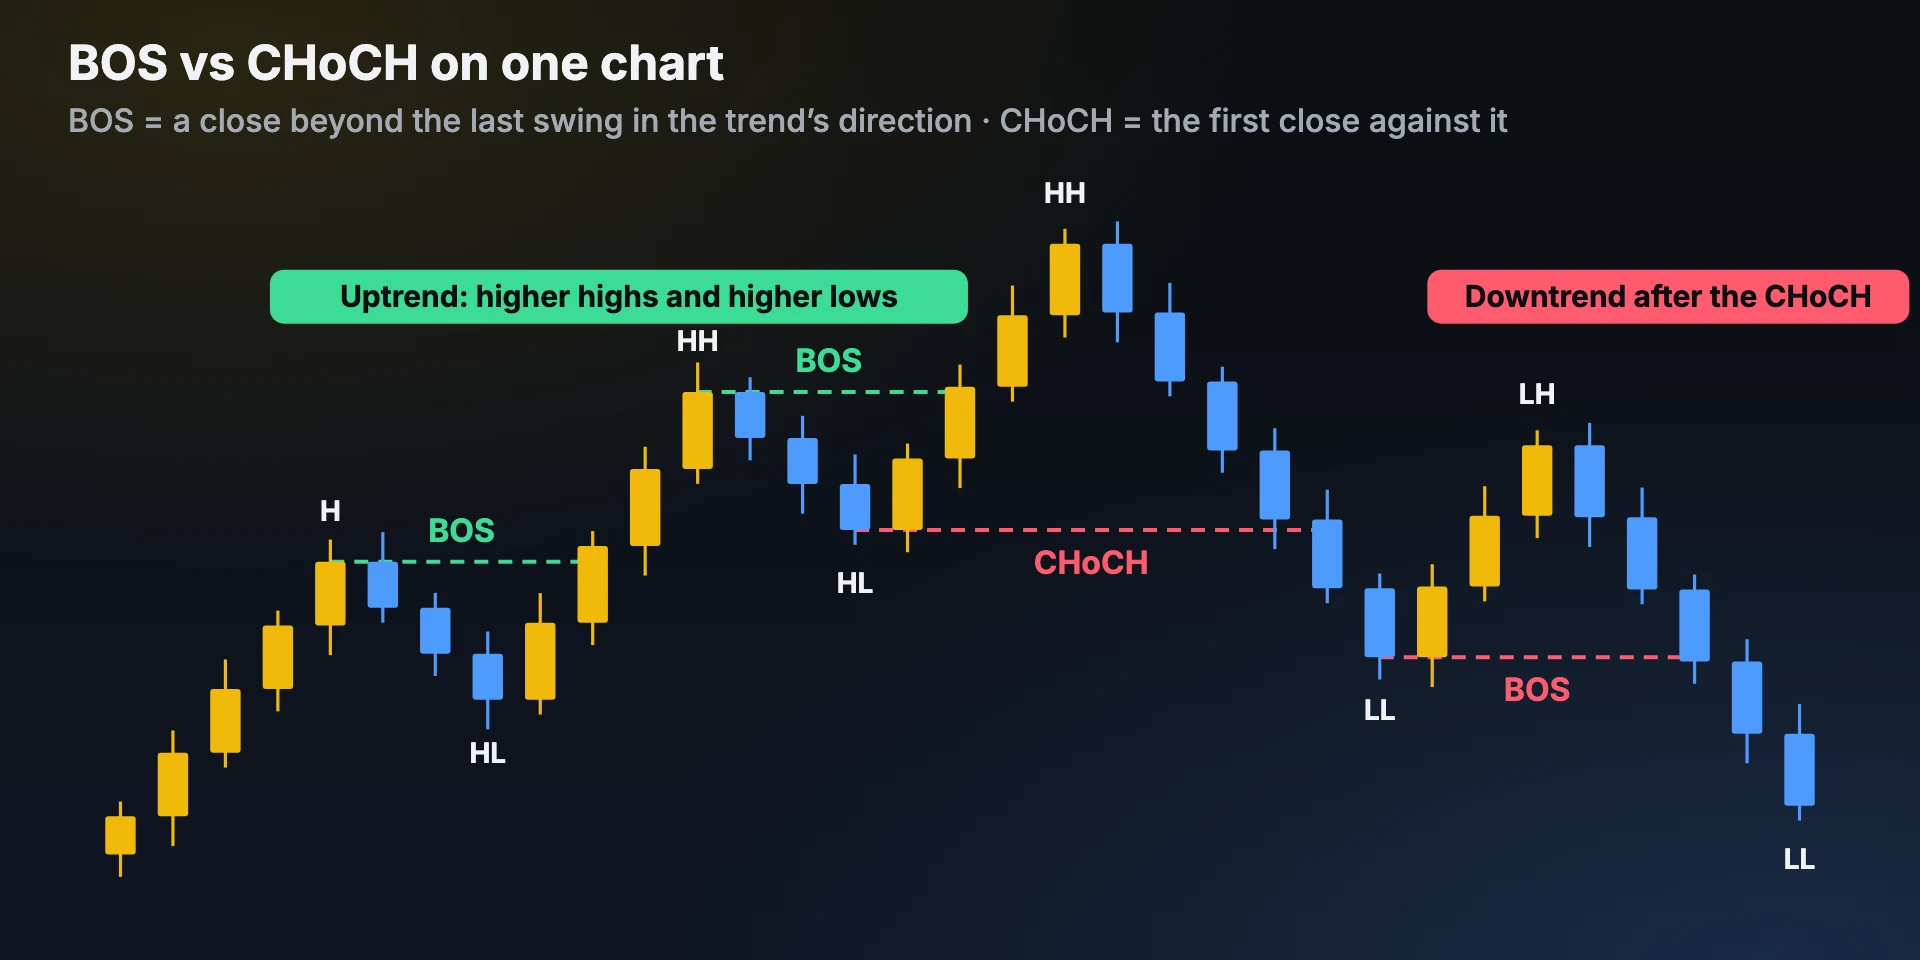
| BOS · break of structure | CHoCH · change of character | |
|---|---|---|
| What breaks | The last swing in the trend’s direction (the last high in an uptrend) | The last swing against the trend (the last higher low in an uptrend) |
| What it says | The trend continues | The trend may be ending |
| How often | Many times in one trend | Once, at the turn |
| After it | Traders look for a pullback to join the trend | Traders wait for confirmation before trading the other way |
First, mark the swings
Both terms depend on swing highs and swing lows, so mark those first:
- Swing high: a candle whose high is above the highs of the candles on both sides of it. A common rule is two or three candles on each side.
- Swing low: a candle whose low is below the lows of the candles on both sides.
- Uptrend: higher highs (HH) and higher lows (HL). Downtrend: lower highs (LH) and lower lows (LL).
Pick one rule for what counts as a swing and keep it. If you change the rule from chart to chart, you can call any break a BOS or a CHoCH after the fact.
BOS: break of structure
In an uptrend, a bullish BOS is a candle that closes above the last swing high. It confirms a new higher high. In a downtrend, a bearish BOS is a close below the last swing low.
CHoCH: change of character
A CHoCH is the first break against the trend. In an uptrend that is a close below the last higher low, the low that started the move to the last high. In a downtrend it is a close above the last lower high.
A CHoCH is not a downtrend yet. It becomes one when price makes a lower high and then breaks the next low with a bearish BOS, as on the chart above.
Close or wick?
Most traders count a break only when a candle closes beyond the level. A wick through a high or low that closes back inside is a different event: often a liquidity sweep, where stops beyond the level are taken and price turns back. Treating every wick as a BOS turns sweeps into fake trend signals.
Some traders call a strong CHoCH an MSS (market structure shift), usually when the break comes with a large, fast candle. The idea is the same.
Internal and swing structure
Every timeframe has its own structure. A CHoCH on the 5-minute chart can be an ordinary pullback inside a 4-hour uptrend. Traders often split it into:
- Swing (external) structure: the main highs and lows on your higher timeframe. This tells you the trend.
- Internal structure: the small swings inside one leg. A CHoCH here is used to time an entry in the direction of the swing structure.
A common plan: read the trend on the 4-hour or daily chart, then wait for an internal CHoCH on a lower timeframe in that direction after a pullback.
Five common mistakes
- Marking every small pivot. On a noisy chart every candle becomes a swing and every break looks important. Use a fixed swing rule.
- Trading a CHoCH as a reversal on its own. Many CHoCHs are just deeper pullbacks. In our tests a CHoCH entry without other conditions was close to a coin flip after costs (see the SMC test data).
- Counting wicks as breaks. Wait for the close.
- Ignoring the higher timeframe. A 5-minute CHoCH against a strong daily trend fails often.
- Calling a BOS inside a range. In a sideways range, breaks of small highs and lows don’t mean much. Structure works best when there is a clear trend.
How traders use the two
- After a BOS: wait for a pullback, often into discount in an uptrend, and look for an entry in the trend’s direction. Stop below the higher low that led to the BOS.
- After a CHoCH: stop taking trades in the old direction. If you want to trade the new direction, wait for a lower high and a BOS that confirms it, or for a pullback that holds.
- Size from the stop. Structure stops can be wide; the position size calculator keeps the money at risk the same whatever the distance.
Check your own BOS and CHoCH trades
Tag each trade with the signal you used, for example “BOS pullback” and “CHoCH reversal”. After 30 to 50 trades of each, compare their win rate, average R and net R in your journal. Profit Prism Journal groups trades by strategy and tag, after fees, so you can see which of the two pays for you.
For education only. Not investment advice. Chart examples are illustrative.
Frequently asked questions
What is the difference between BOS and CHoCH?
A BOS (break of structure) is a close beyond the last swing in the direction of the trend, so the trend continues. A CHoCH (change of character) is the first close beyond the last swing against the trend, so the trend may be turning.
Is CHoCH the same as a reversal?
No. A CHoCH is the first sign of a possible reversal. Many CHoCHs turn out to be deeper pullbacks. A new trend is confirmed when price makes a lower high (or higher low) and breaks the next swing with a BOS.
Should a BOS be confirmed by a candle close or a wick?
Most traders use the candle close. A wick beyond a level that closes back inside is often a liquidity sweep, not a break of structure.
What is the difference between CHoCH and MSS?
They describe the same idea: structure turning against the old trend. Some traders use MSS (market structure shift) for a CHoCH that comes with a large, fast candle.
Which timeframe is best for BOS and CHoCH?
Read the main trend on a higher timeframe such as 4-hour or daily, and use BOS and CHoCH on a lower timeframe to time entries. Very short timeframes have more noise and higher costs per trade.
See your own numbers
Profit Prism Journal measures every trade in R and shows your win rate, RR, leaks and loss limits — for crypto, forex, stocks and F&O. Try it free for 7 days, no card.
Start the free trialFor education only. Not investment advice. Trading involves substantial risk of loss.