The short answer
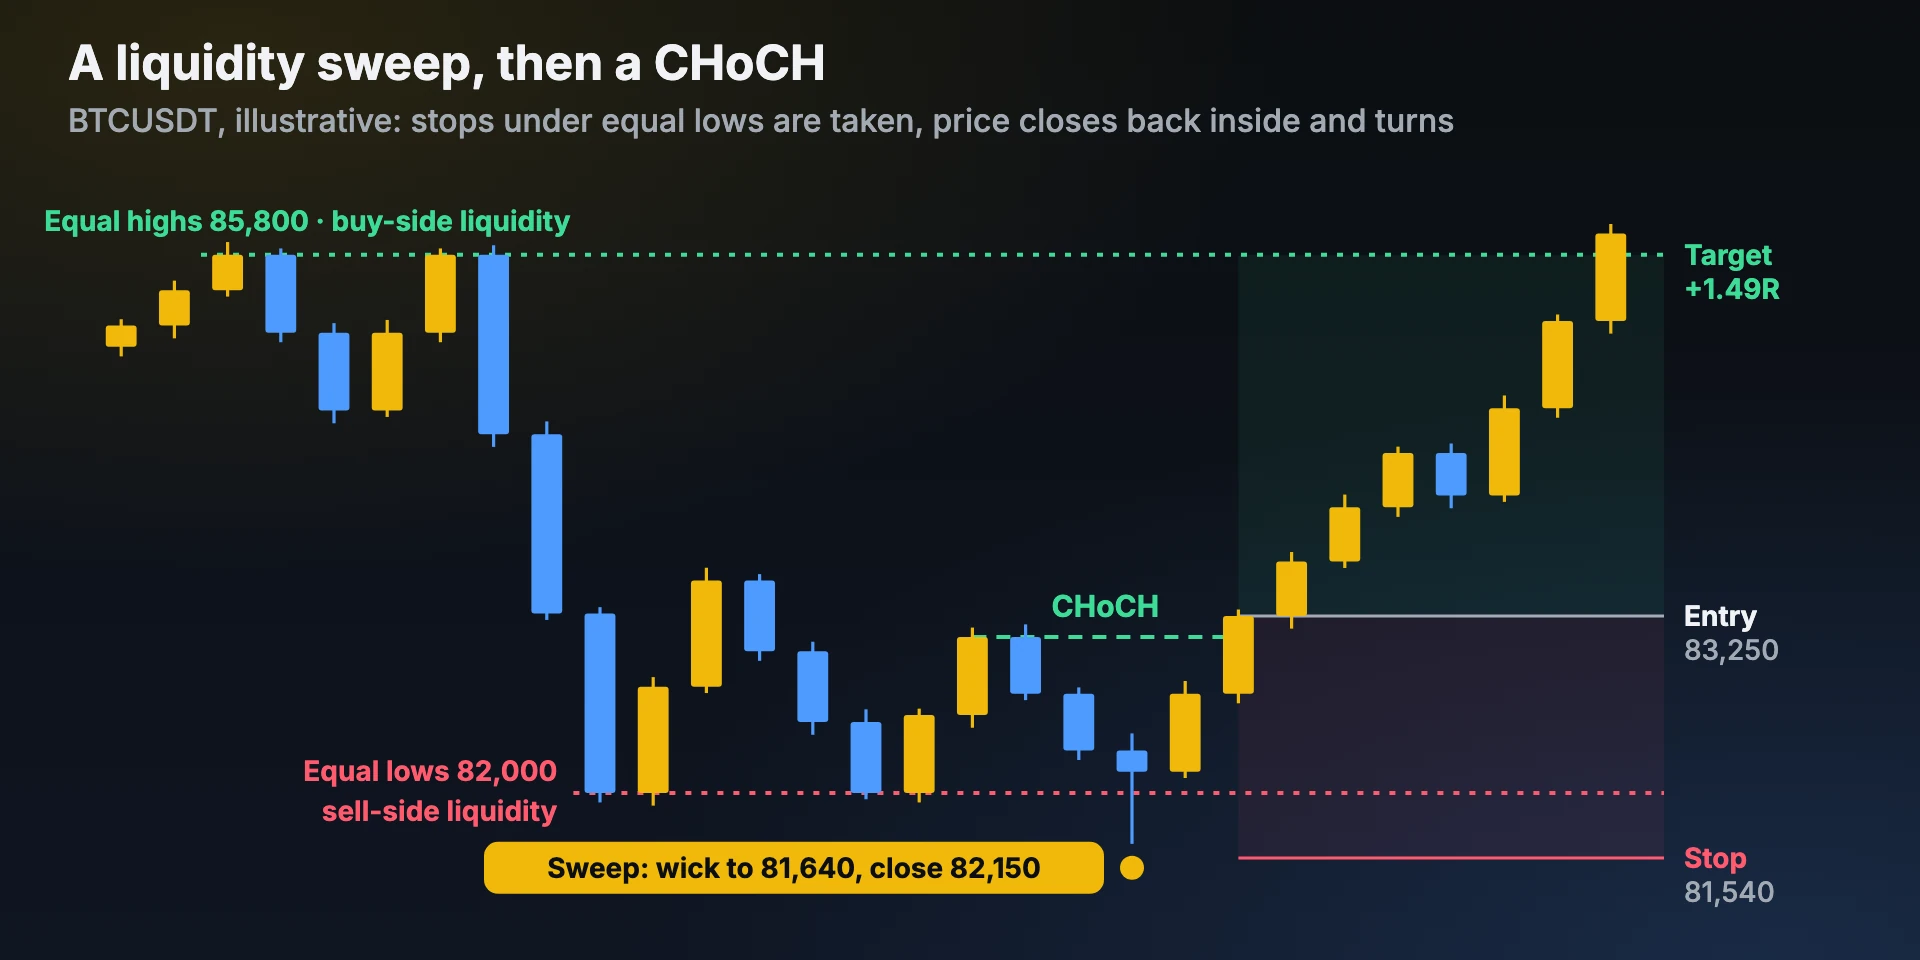
On the chart, price falls to 82,000 twice and leaves equal lows. Many traders put their stops just under them. A third drop wicks to 81,640, fills those stops, and closes back at 82,150. Two candles later price closes above the last lower high at 83,100: a CHoCH. That combination, sweep then CHoCH, is the classic SMC reversal setup.
Where liquidity sits
“Liquidity” here means resting orders, mostly stop losses and breakout entries. They cluster at levels everyone can see:
| Level | Above it (buy-side liquidity) | Below it (sell-side liquidity) |
|---|---|---|
| Equal highs / equal lows | Shorts’ stops, breakout buy orders | Longs’ stops, breakdown sell orders |
| Previous day / week high and low | Stops of shorts from that day | Stops of longs from that day |
| Swing highs and lows | Stops of traders short below them | Stops of traders long above them |
| Round numbers (24,000, 80,000) | Orders of every kind cluster here | |
Equal highs and equal lows are the clearest pools: two or more tops or bottoms at nearly the same price invite stops just beyond them.
Sweep or breakout?
| Liquidity sweep | Breakout | |
|---|---|---|
| The candle | Wicks beyond the level, closes back inside | Closes beyond the level |
| The next candles | Move away from the level, back into the range | Stay beyond it; a retest holds |
| Volume | Spike on the sweep, then fades | Stays high as price moves on |
| What follows | Often a move to the other side of the range | A new trend leg |
The hard part is that you only know which one it was after a candle or two. A wick that closes back inside can still turn into a breakout on the next candle. That is why SMC traders wait for a second sign before entering.
What happens after a sweep
Three things can follow, and the chart decides, not the name of the pattern:
- Reversal. Price closes back inside and then breaks the last swing the other way with a CHoCH. This is the trade SMC traders look for: the move often runs to the liquidity on the other side, such as the equal highs on the chart.
- Back into the range. Price returns inside and drifts sideways. No CHoCH comes, and the trade never sets up.
- It becomes a breakout. After closing back inside, price breaks the level again and this time holds beyond it. Traders who bought the “sweep” are stopped out. This is the reason for a stop beyond the sweep’s wick.
How traders trade a sweep
- Mark the pool before price gets there: equal lows, the previous day’s low, a clear swing low.
- Wait for the close back inside. No close, no sweep.
- Wait for the CHoCH on the same or a lower timeframe: a close above the last lower high (for a long).
- Stop beyond the sweep’s wick, with a small buffer. The wick is the level the setup is wrong at.
- Target the opposite pool: the equal highs, the previous day’s high or the range top.
Check the reward before you enter. If the opposite pool is close, the trade may not be worth the risk; the risk reward calculator does the sum.
What the data says
We tested “sweep + CHoCH” on six years of crypto perpetual candles, with fees, slippage and funding included. On 4-hour charts, taken only in the direction of the daily trend, it averaged +0.16R per trade on BTC, ETH and SOL and +0.23R on XRP, BNB and DOGE, which we never looked at while choosing the rules. On 15-minute charts it lost on both sets (−0.08R and −0.11R a trade), mostly to costs. Full results and the other setups are in the SMC test data.
Don’t be the liquidity
- Don’t put your stop exactly at the obvious low. Place it beyond the structure with a buffer, such as a fraction of the ATR, and size down to keep the risk the same. See where to put a stop loss.
- Don’t buy the first poke through a high. Wait for a close and a hold, or a retest.
- Be careful around the previous day’s high and low and round numbers. Moves there often reverse.
Track your sweep trades
Tag every sweep trade and note which pool was swept: equal lows, the previous day’s low, a session low. After a few dozen trades, Profit Prism Journal shows the win rate and net R for each tag after fees, so you can see which sweeps are worth taking for you.
For education only. Not investment advice. The chart is an illustrative example, not a real trade.
Frequently asked questions
What is a liquidity sweep in trading?
A liquidity sweep is a quick move beyond an obvious high or low, where stop-loss orders cluster, followed by a close back inside the range. The move fills those orders and then reverses.
What is the difference between a liquidity sweep and a breakout?
A sweep wicks beyond the level and closes back inside. A breakout closes beyond the level and holds there, often after a retest.
What happens after a liquidity sweep?
Price either reverses with a change of character (CHoCH) and moves toward the liquidity on the other side, drifts back into the range, or breaks the level again and turns into a real breakout.
Where should the stop be on a sweep trade?
Beyond the wick of the sweep candle, with a small buffer. If price trades past that wick again, the sweep has failed.
Is a liquidity sweep the same as a stop hunt?
The terms are used for the same pattern. “Stop hunt” suggests someone moved the price on purpose; nobody can see that. What you can see is price running past a level with many stops and closing back inside.
See your own numbers
Profit Prism Journal measures every trade in R and shows your win rate, RR, leaks and loss limits — for crypto, forex, stocks and F&O. Try it free for 7 days, no card.
Start the free trialFor education only. Not investment advice. Trading involves substantial risk of loss.