The position sizing formula
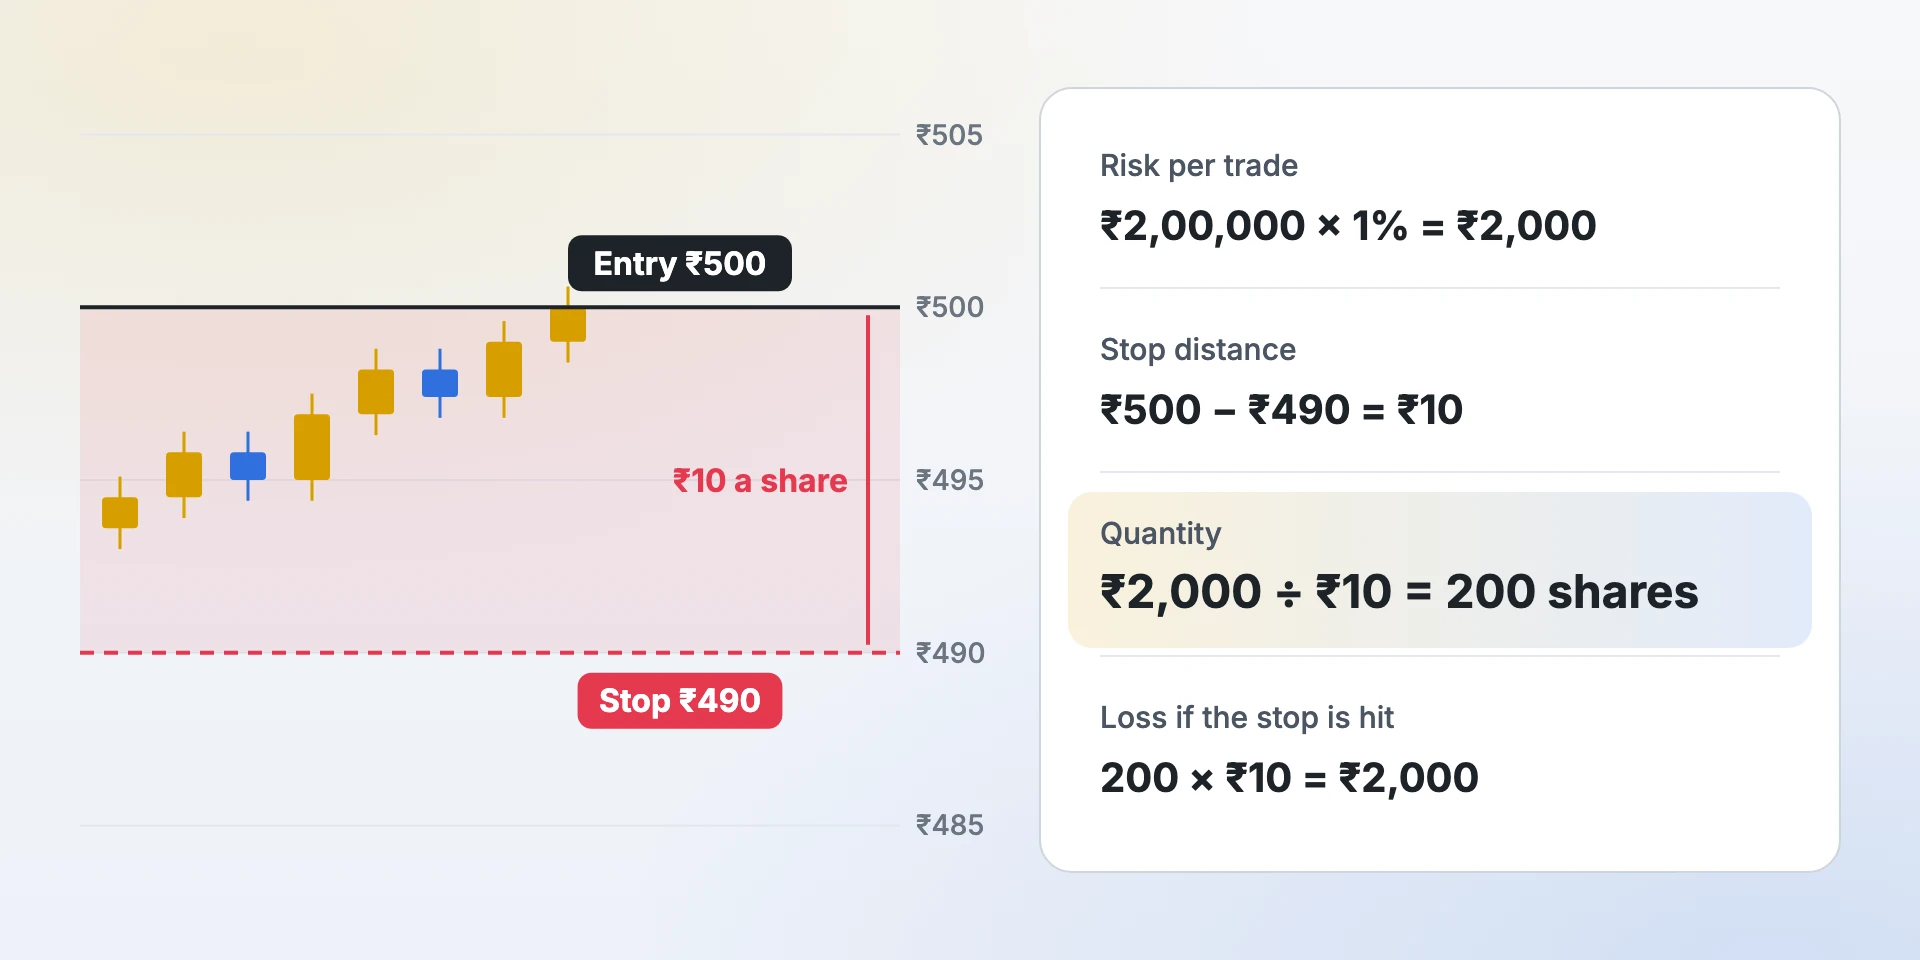
Quantity = Risk amount ÷ |Entry − Stop loss|
Notice what is not in the formula: how confident you feel, how much you lost yesterday, or how much margin your broker offers. Size comes from your stop and your risk rule — nothing else.
Worked examples
| Market | Account and risk | Entry / stop | Size |
|---|---|---|---|
| Stock | ₹2,00,000 × 1% = ₹2,000 | ₹500 / ₹490 (₹10) | 200 shares |
| Nifty option | ₹2,000 | ₹152.50 / ₹128 (₹24.50) | 81 units → 1 lot of 75 (₹1,837.50 risk) |
| Forex (EURUSD) | $5,000 × 1% = $50 | 1.1650 / 1.1680 (30 pips) | 16,666 units → 0.16 lots |
| Crypto (BTCUSDT) | $1,000 × 1% = $10 | 84,200 / 83,600 (600) | 0.0166 BTC |
For F&O and forex, always round down to whole lots or the broker’s lot step, so the real risk never goes above your plan. If even one lot is too much, the trade is too big for your account — skip it or find a valid tighter stop.
How much should you risk per trade?
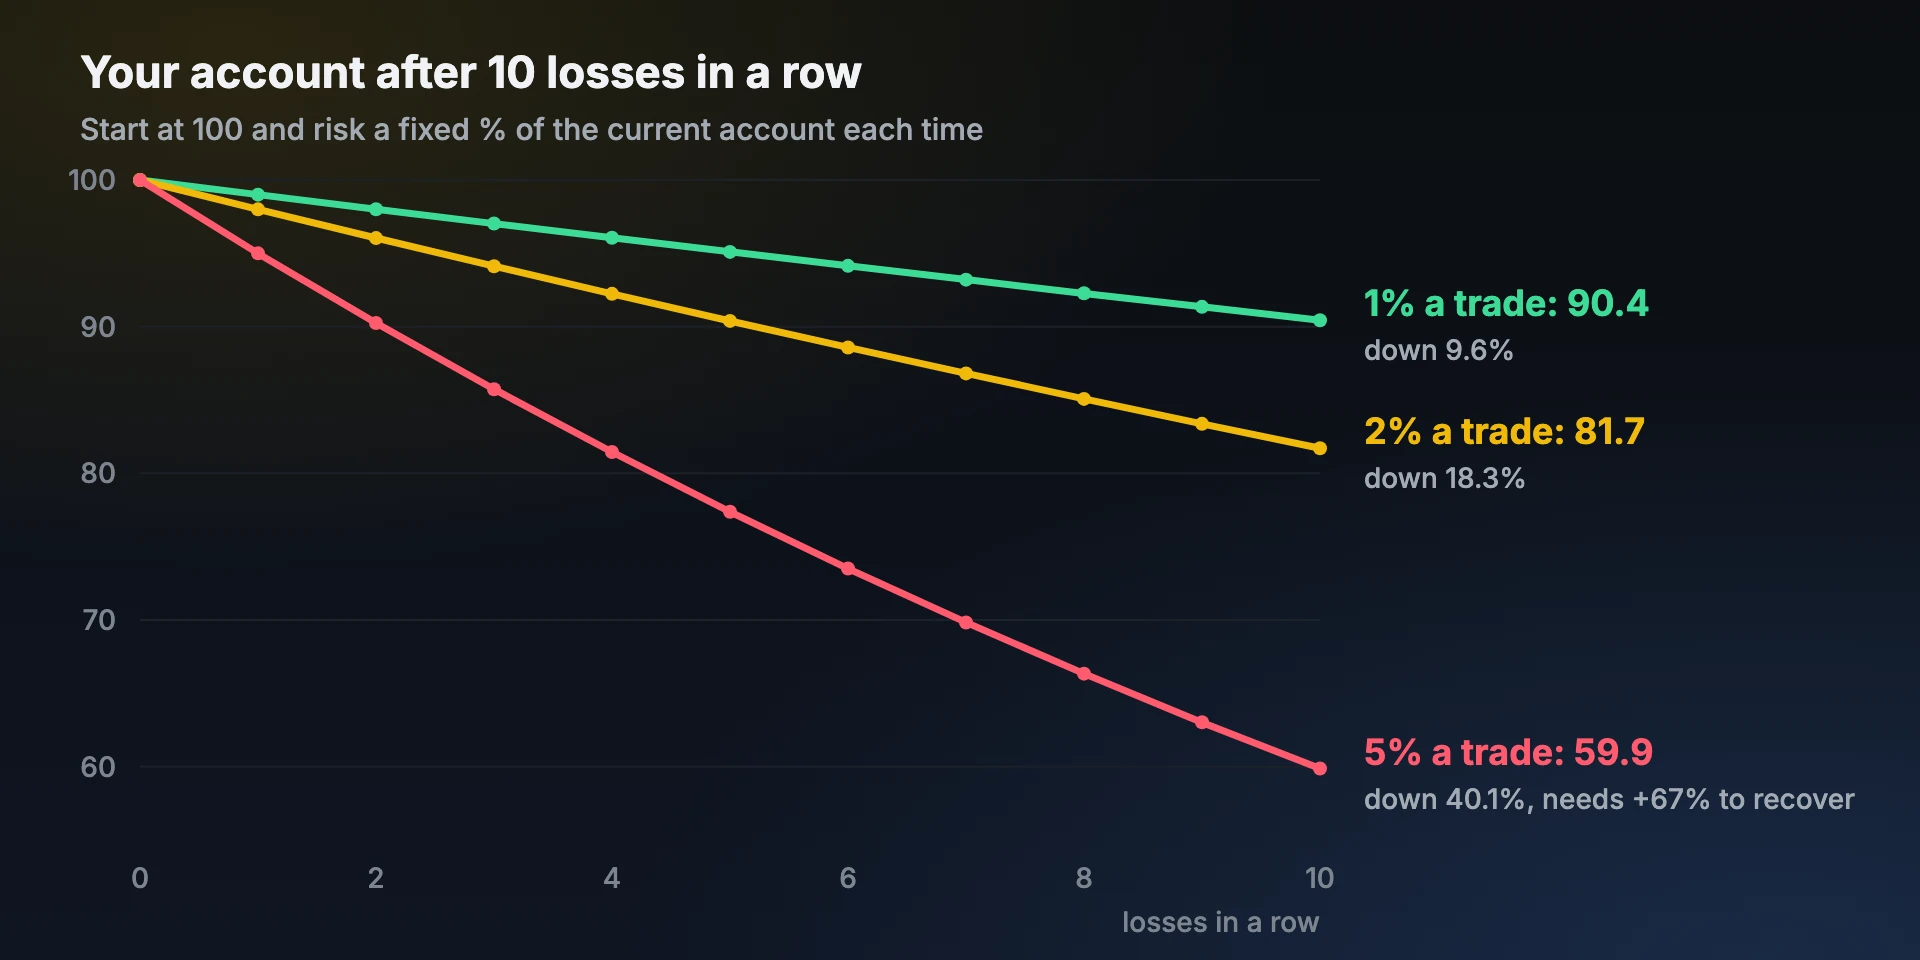
Many traders risk 0.5% to 2% of their account per trade. The reason is losing streaks: ten losses in a row at 1% cost about 9.6% of the account; at 5% they cost about 40%, which needs a 67% gain to recover. Choose a number you will follow every time, including after a loss.
Sizing methods
Fixed fractional
Risk the same percent of the current account on every trade. Size grows after wins and shrinks after losses automatically.
Fixed amount
Risk the same money (₹2,000) on every trade and review the number monthly. Simple and easy to measure in R.
Volatility-based
Place the stop by ATR so it suits the market’s noise, then size from that stop. Volatile markets get smaller positions.
Step-up after highs
Raise the risk amount only after a new equity high, and cut it after a set drawdown — compounding with brakes.
Sizing a trade you enter in two parts
If you plan to buy in two parts, the total loss at the stop must still equal your risk. With ₹2,000 of risk, the first entry at ₹500, the second at ₹495 and the stop at ₹490, each share of the first part risks ₹10 and each share of the second risks ₹5:
Total 266 shares, average entry ₹497.50, loss at the stop 266 × ₹7.50 = ₹1,995
If the second entry never fills, you are in with 133 shares and only ₹1,330 at risk, which is fine; never “top up” the first part to make up the difference.
Margin and leverage are not position size
Margin and leverage decide how much capital the broker blocks, not how much you can lose. A 10x or 50x position with the same stop and quantity loses the same amount at the stop. Size from the stop first, then check you have the margin — and, in crypto futures, that liquidation sits beyond your stop.
Common position sizing mistakes
- Choosing quantity first (“1 lot”, “100 shares”) and the stop afterwards.
- Bigger size after a loss to win it back — see revenge trading.
- Rounding lots up.
- Several positions that move together, each “1%” but together 4%.
- Ignoring fees on tight stops — they are part of the loss.
Calculators
Use the position size calculator for stocks, F&O lots, forex and gold, or the crypto position size calculator for leverage, margin and liquidation.
Frequently asked questions
What is position sizing in trading?
Position sizing is deciding how many shares, lots, units or coins to trade so that the loss at your stop equals the amount you planned to risk.
How do I calculate position size?
Divide the amount you are willing to lose by the distance between your entry and your stop: quantity = risk ÷ |entry − stop|. For lots, divide by the lot size and round down.
How much should I risk per trade?
Many traders risk 0.5% to 2% of their account per trade, so a normal losing streak cannot do serious damage. Pick one number and follow it every time.
Does leverage change my position size?
No. Leverage changes the margin the broker blocks. With the same quantity and stop, the loss at the stop is the same at any leverage.
Should position size change after a loss?
Not upward. With fixed-fractional sizing it shrinks slightly as the account falls; increasing size to recover a loss is one of the fastest ways to a big drawdown.
See your own numbers
Profit Prism Journal measures every trade in R and shows your win rate, RR, leaks and loss limits — for crypto, forex, stocks and F&O. Try it free for 7 days, no card.
Start the free trialFor education only. Not investment advice. Trading involves substantial risk of loss.