What is maximum drawdown?
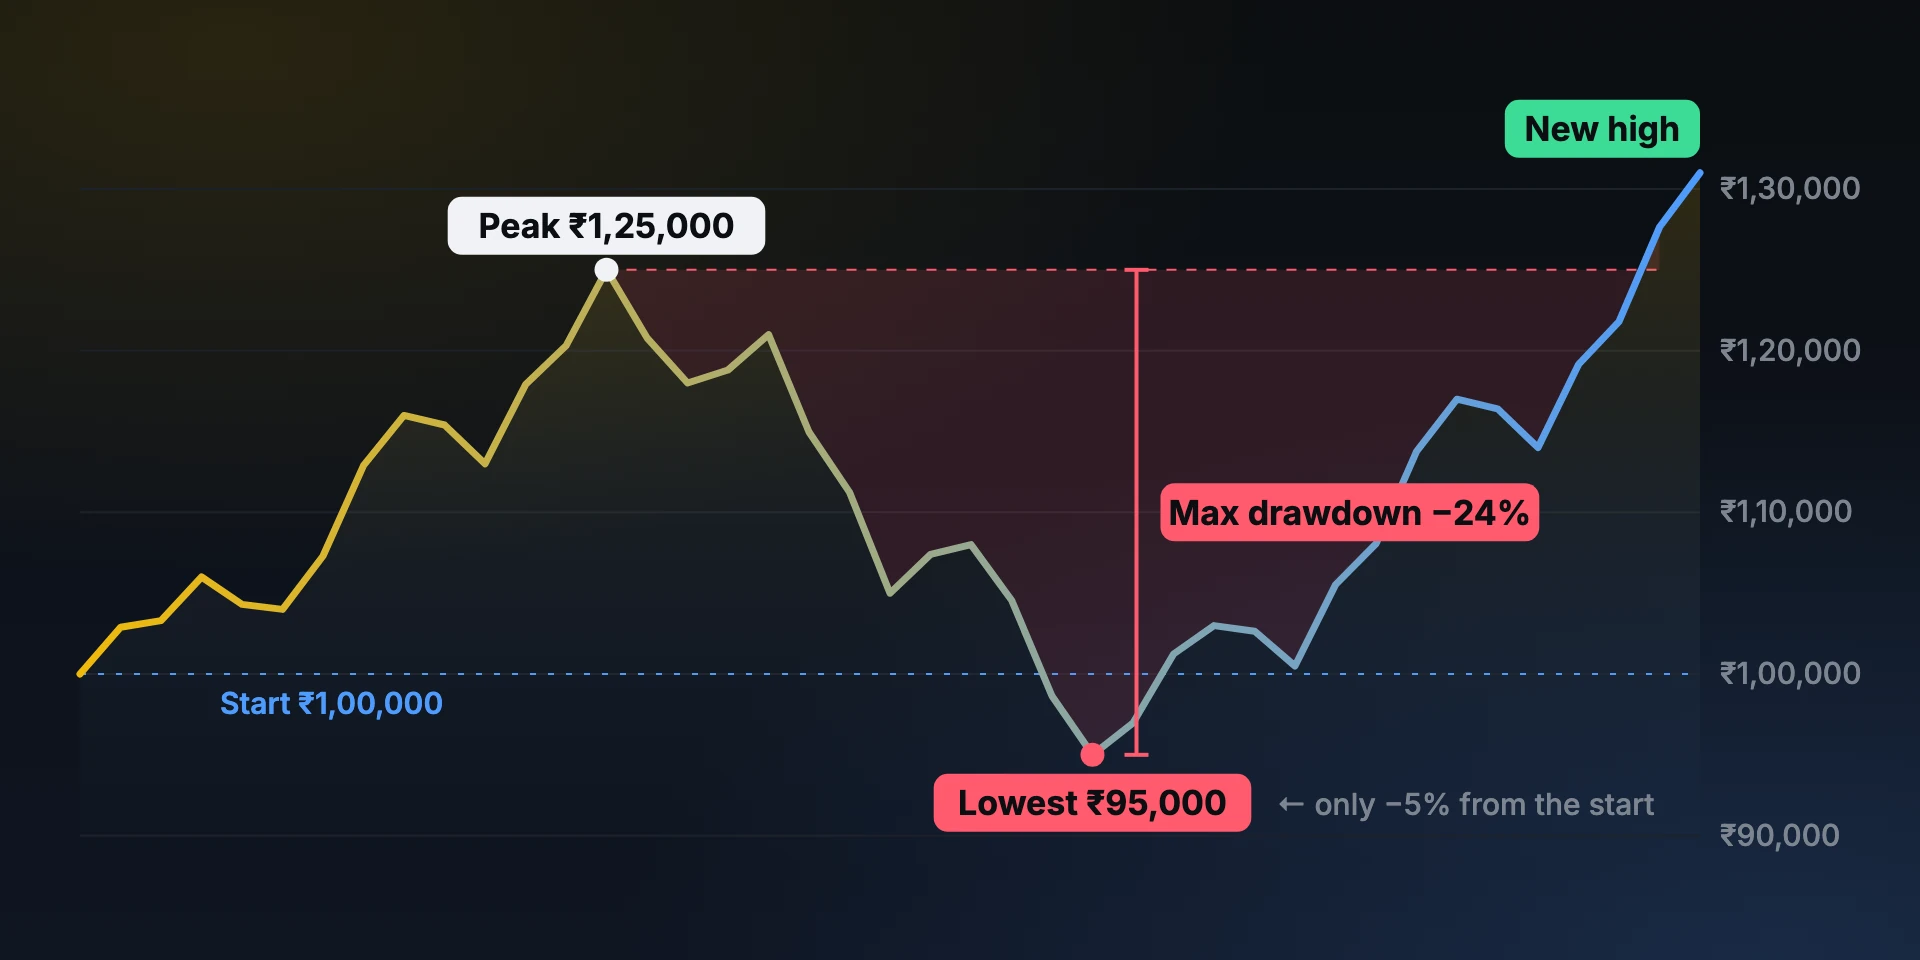
A drawdown is any fall from your account’s highest point so far. The maximum drawdown is the deepest of those falls over a period. It is measured from a peak to the lowest point before the account makes a new high.
Why it matters: the recovery maths
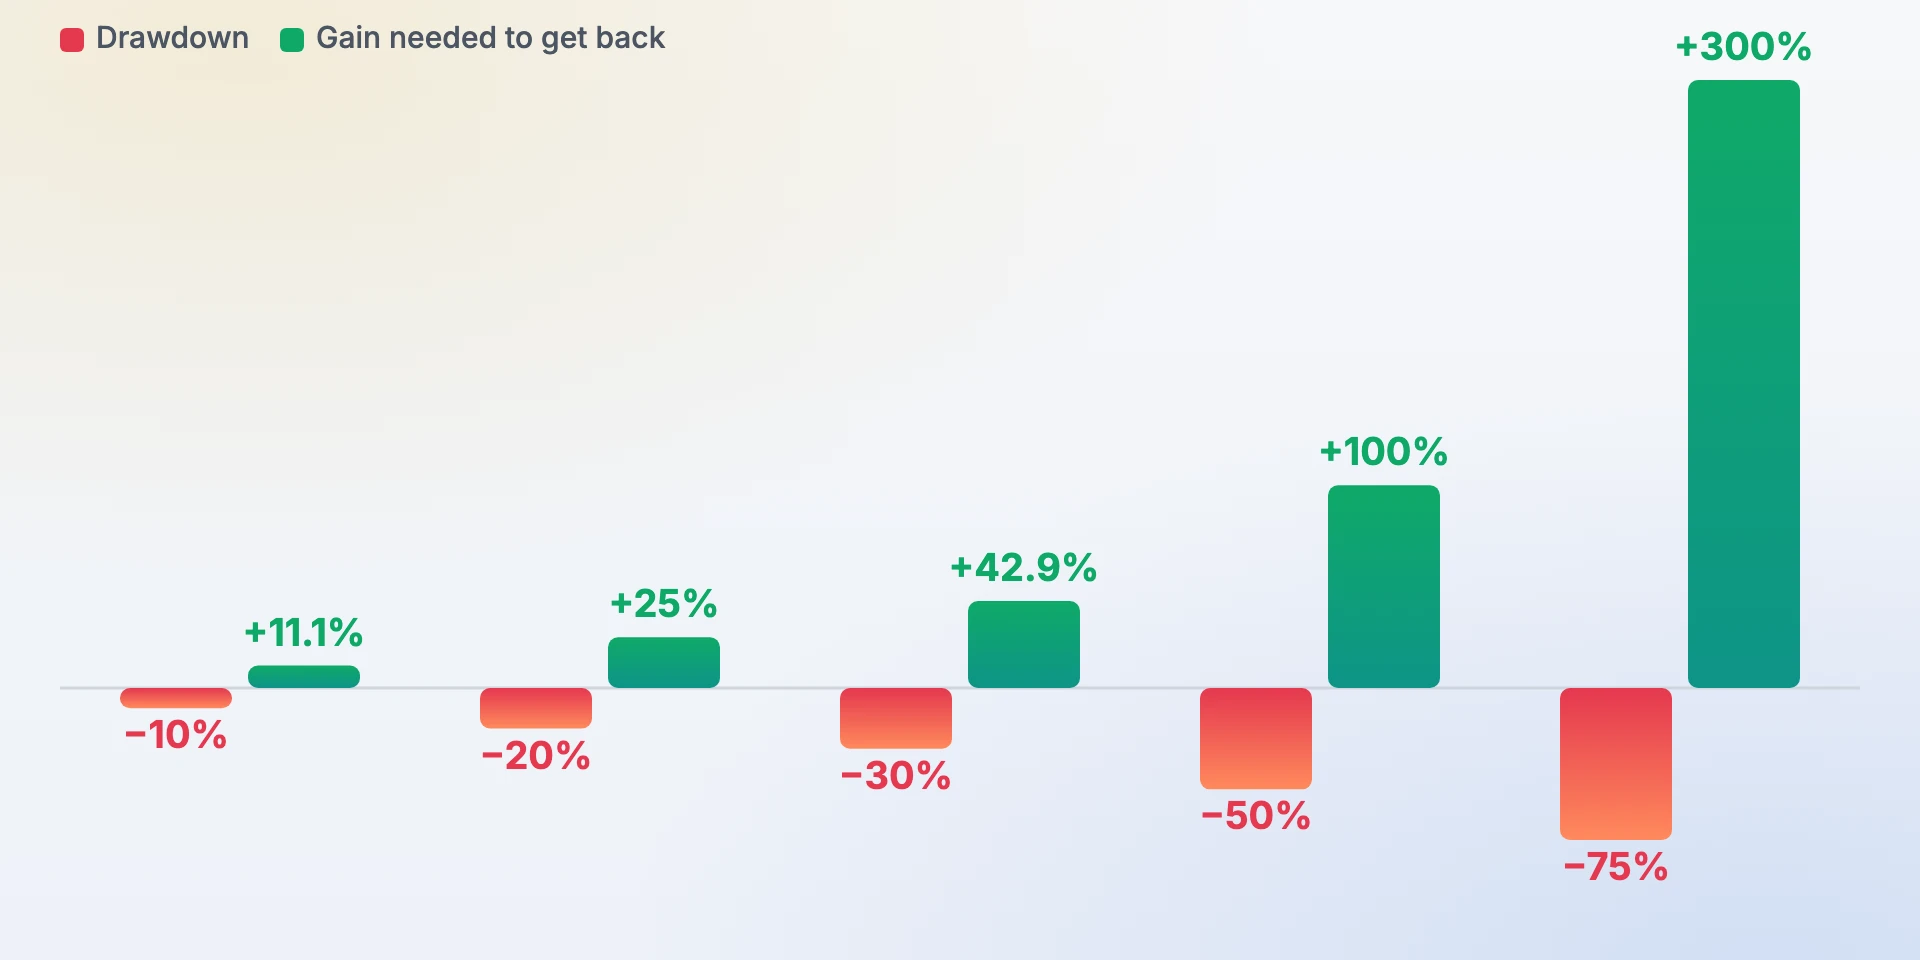
Losses and recoveries are not symmetrical. The deeper the drawdown, the bigger the gain you need just to get back:
| Drawdown | Gain needed to recover |
|---|---|
| −10% | +11.1% |
| −20% | +25% |
| −30% | +42.9% |
| −50% | +100% |
| −75% | +300% |
Drawdown in R
Measuring in R (profit ÷ risk per trade) makes drawdown comparable across account sizes and markets. Add up your R trade by trade; the drawdown at any point is the running total minus its highest value so far.
| Trade | R | Running total | Peak so far | Drawdown |
|---|---|---|---|---|
| 1 | +2.0 | +2.0 | +2.0 | 0 |
| 2 | −1.0 | +1.0 | +2.0 | −1.0 |
| 3 | −1.0 | 0.0 | +2.0 | −2.0 |
| 4 | +3.0 | +3.0 | +3.0 | 0 |
| 5 | −1.0 | +2.0 | +3.0 | −1.0 |
Maximum drawdown here is −2R (after trade 3).
Max drawdown formula in Excel or Google Sheets
With your running total (equity or cumulative R) in column B starting at B2:
D2 (drawdown): =B2-C2 or, as a %, =B2/C2-1
Max drawdown: =MIN(D:D)
Copy C2 and D2 down. Our free trading journal template already does this in R.
Risk per trade decides your drawdown
Every strategy has losing streaks. Ten losses in a row at a fixed percentage of the account cost:
| Risk per trade | Drawdown after 10 losses | Gain needed to recover |
|---|---|---|
| 1% | −9.6% | +10.6% |
| 2% | −18.3% | +22.4% |
| 5% | −40.1% | +67.0% |
Max drawdown at prop firms
Funded-account programmes usually set two limits: a daily loss limit and a maximum (overall) drawdown. The maximum drawdown can be static (measured from the starting balance) or trailing (it follows your highest balance or equity, sometimes only at end of day — “EOD”). A trailing drawdown is stricter: profits raise the line you must not fall below. Rules differ between firms, so read yours exactly and track your distance to the limit every day.
How to keep drawdowns small
- Risk a small, fixed amount per trade — often 0.5–2% — sized from your stop.
- Use daily and weekly loss limits in R, and stop when they are hit.
- Avoid several trades that are really one bet (correlated positions).
- Cut size after a drawdown of a set depth, and only restore it after a new high.
How a journal helps
Profit Prism Journal draws your equity curve in R, shows your drawdown, and warns you as you approach your daily or weekly loss limit — so a drawdown is something you see coming, not something you discover at month end.
Frequently asked questions
What is maximum drawdown?
Maximum drawdown is the largest fall in an account or strategy from a peak to a later low, before a new peak is reached, usually shown as a percentage or in R.
How do you calculate max drawdown?
Track the highest value reached so far; at each point the drawdown is the current value minus that peak. The maximum drawdown is the most negative of those values. As a percentage: (trough − peak) ÷ peak.
What is a good maximum drawdown?
It depends on the strategy and your tolerance, but many traders aim to keep it under 20–25%. The lower your risk per trade, the smaller the drawdown from the same losing streak.
What is a trailing drawdown at a prop firm?
A trailing drawdown limit moves up with your highest balance or equity (sometimes only at end of day), so profits raise the level you must stay above. Static drawdown is measured from the starting balance instead.
How much do I need to gain to recover from a drawdown?
Gain needed = drawdown ÷ (1 − drawdown). A 20% drawdown needs +25%, a 50% drawdown needs +100%.
See your own numbers
Profit Prism Journal measures every trade in R and shows your win rate, RR, leaks and loss limits — for crypto, forex, stocks and F&O. Try it free for 7 days, no card.
Start the free trialFor education only. Not investment advice. Trading involves substantial risk of loss.