What RSI measures
The Relative Strength Index, from J. Welles Wilder, compares the size of recent up moves with recent down moves on a 0–100 scale. Above 70 means recent gains have been much bigger than losses; below 30 the opposite. “Overbought” doesn’t mean price must fall: in a strong uptrend RSI can stay above 70 for weeks. That’s the problem with the textbook strategy.
The rules we tested
RSI length 14, stop 2 × ATR(14) from the entry in every version.
- Textbook 30/70: long when RSI climbs back above 30, short when it falls back below 70; exit when RSI crosses 50.
- Pullback with the trend, exit at 70/30: only when the daily trend is up (daily close above the 50-day EMA, and the 20-day EMA above the 50-day), go long when RSI dips below 40 and climbs back above it; when the daily trend is down, short when RSI rises above 60 and falls back below it. Exit when RSI reaches 70 (30 for shorts).
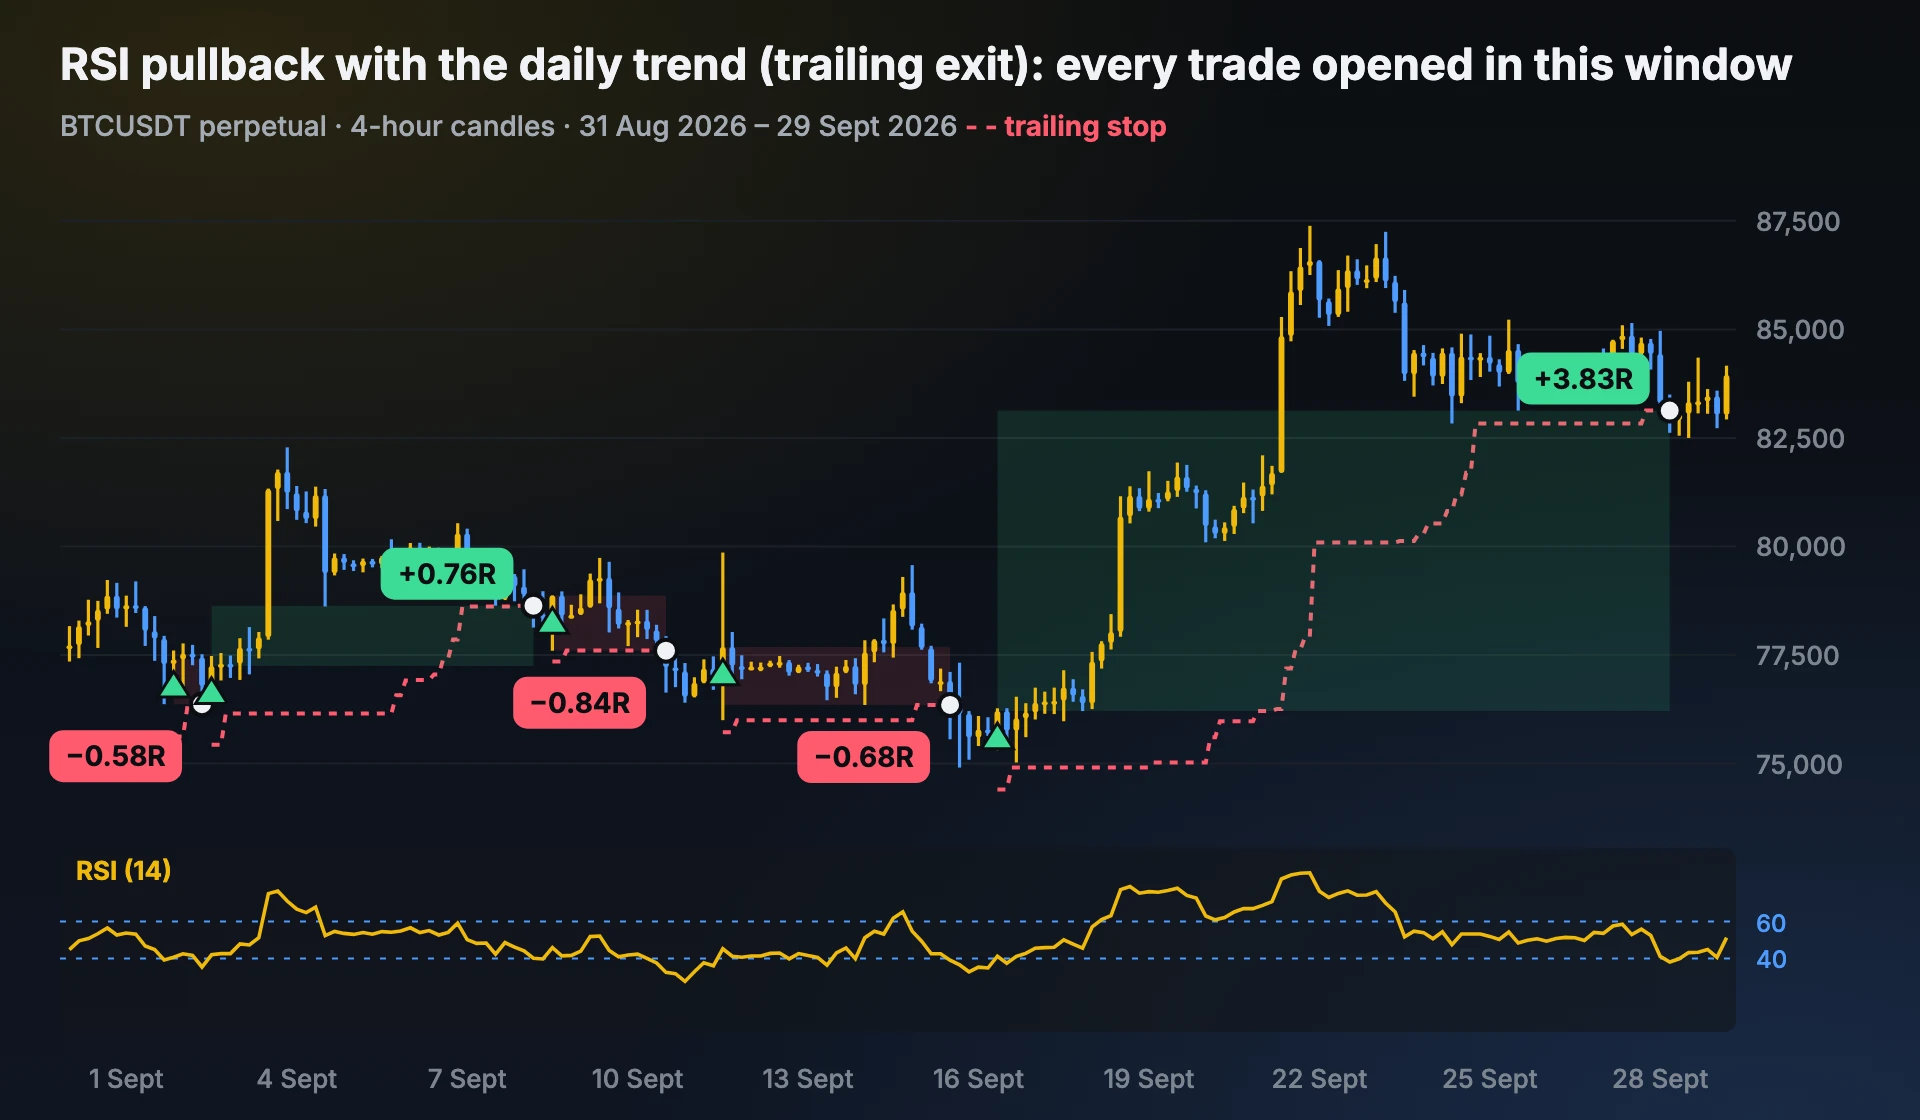
- Pullback with the trend, trailing exit: the same entries, no fixed exit; the stop trails to the lowest low of the last 20 candles (highest high for shorts).
We wrote the two pullback versions into the test code before running them and tried no others, so their results aren’t the best of many attempts.
Results: textbook vs pullback
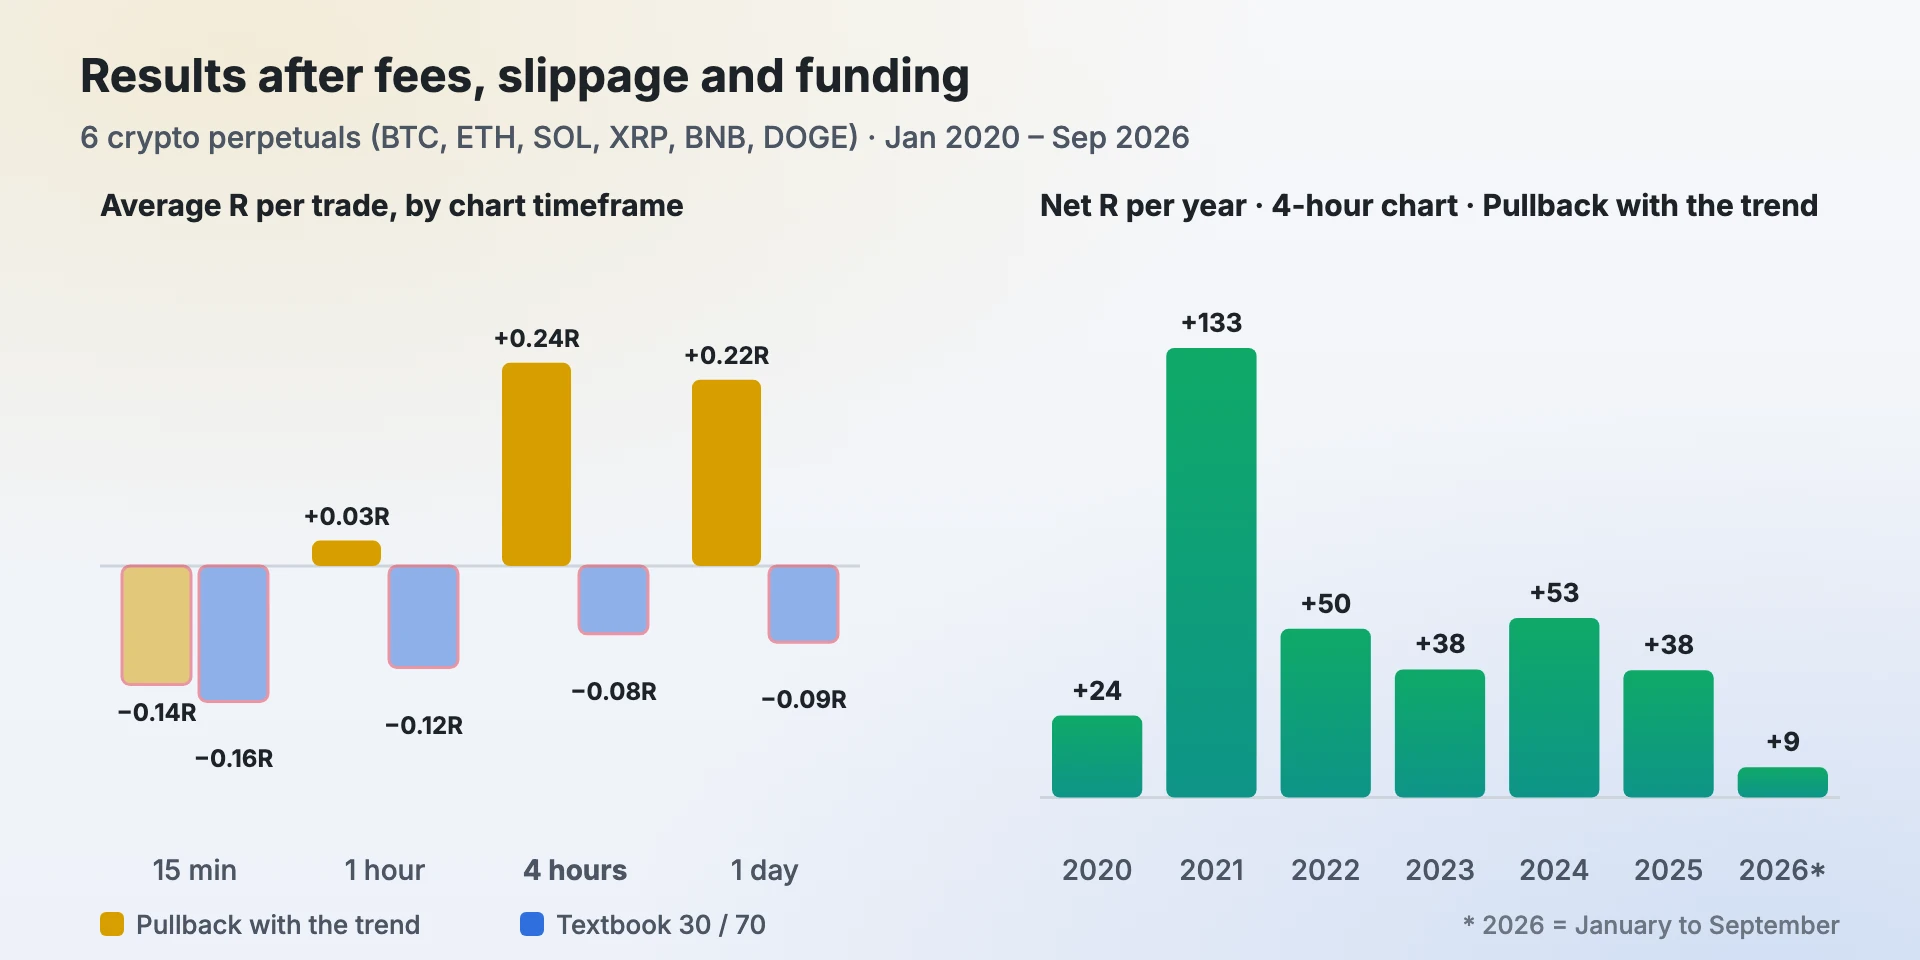
Average R per trade after fees, slippage and funding, six coins, 2020 – September 2026:
| Version | 15 min | 1 hour | 4 hours | 1 day | Win rate, 4 hours |
|---|---|---|---|---|---|
| Textbook 30/70 | −0.16R | −0.12R | −0.08R | −0.09R | 51.9% |
| Pullback with the trend, exit at 70/30 | −0.17R | −0.04R | +0.07R | +0.14R | 35.3% |
| Pullback with the trend, trailing exit | −0.14R | +0.03R | +0.24R | +0.22R | 30.8% |
The pullback with a trailing exit on every timeframe:
| Chart | Trades | Win rate | Average win | Average loss | Average R a trade | Max drawdown | Longest losing run | Years positive |
|---|---|---|---|---|---|---|---|---|
| 15 min | 31,373 | 24.5% | +1.82R | −0.77R | −0.14R | 4384R | 60 | 0 of 7 |
| 1 hour | 7,169 | 27.5% | +1.96R | −0.70R | +0.03R | 303R | 40 | 4 of 7 |
| 4 hours | 1,419 | 30.8% | +2.24R | −0.64R | +0.24R | 55R | 25 | 7 of 7 |
| 1 day | 31 | 35.5% | +1.72R | −0.60R | +0.22R | 3R | 5 | 5 of 7 |
Per year on 4-hour charts: 2020 +24R · 2021 +133R · 2022 +50R · 2023 +38R · 2024 +53R · 2025 +38R · 2026* +9R. Per coin: BTC +0.02R · ETH +0.57R · SOL +0.33R · XRP −0.07R · BNB +0.15R · DOGE +0.50R.
What the numbers say
- Textbook RSI lost on every timeframe. On 4-hour charts it won 51.9% of its trades, with an average win of +0.75R and an average loss of −0.99R. Fading a strong move feels safe and is right often, but the times it’s wrong cost more.
- Trading with the trend fixed the direction; the exit decided the result. Taking profit at RSI 70 made the pullback version barely positive (+0.07R on 4-hour charts). Letting a trailing stop run the winners made +0.24R, with a lower win rate (30.8%).
- It held up in both periods: +0.30R a trade in 2020–2023 and +0.16R since, on 4-hour charts.
- Not on every coin: BTC was about flat (+0.02R) and XRP slightly negative.
- Daily charts gave very few trades (31), too few to judge. 15-minute charts lost after costs.
Crypto rose a lot between 2020 and 2026, so trend-following strategies earned most of their R on longs. A market that falls or goes sideways for years would give a different result. Past results don’t predict future ones.
How traders use RSI instead
- As a pullback gauge in a trend: in an uptrend RSI tends to dip to 40–50 rather than 30; a turn back up from there is the entry we tested.
- For divergence: price makes a new high while RSI makes a lower high, a sign the move is tiring. It’s a warning, not an entry on its own. We haven’t tested it here.
- As a filter, not a trigger: for example, skip longs when RSI is already above 75.
The rule vs your own judgement
A backtest measures the rule, not the trader. Most people who use RSI don’t follow it like a machine: they book part of the profit near a big level, skip a choppy day, or wait for a cleaner candle. That can make the result better or worse than the numbers above. On average it makes it worse: SEBI’s study of Indian F&O traders found that 93% of individual traders lost money over the three years to March 2024.
The way to find out which one you are is to measure it. Log every trade you take with this strategy under one strategy tag in your journal, note when you overrode the rule and why, and after 50 or more trades compare your average R with the rule’s. If your judgement adds R, keep it. If it costs R, follow the rule more closely. Our guide on how to journal trades shows what to record.
How to test it yourself
- Write the rules down exactly as above, or with your own changes.
- Open a chart with RSI (14) and a daily trend reference such as the 20 and 50 EMA on the daily chart. In Profit Prism’s PPM Chart (included with every plan) it’s in the Indicators list, and Bar Replay lets you step through history one candle at a time without seeing what comes next.
- Take every signal the rules give, including the ones you don’t like, and record entry, stop, exit and R. Our free trading journal template does the maths.
- After 50–100 trades, compare your average R per trade with the table above, then read how to backtest a trading strategy for the mistakes to avoid.
How we tested it
- Markets: BTC, ETH, SOL, XRP, BNB and DOGE USDT perpetual futures (public exchange candles), each from its first candle; trades counted from 1 January 2020 to 30 September 2026.
- Rules: the textbook settings above, chosen before we saw any result and never tuned. One trade at a time per coin; a trade still open on 30 September 2026 isn’t counted.
- Fills: entries at the close of the signal candle. A stop is a stop order: it fills at the stop, or at the open if a candle gaps through it. If one candle touches both the stop and a target, we count the stop.
- Costs on every trade: 0.05% exchange fee and 0.02% slippage on each side, plus the real funding payments while the trade was open.
- Results in R: 1R is the distance from entry to the first stop, so a +2R trade made twice what it risked. This lets BTC at 60,000 and DOGE at 0.20 sit in one table.
- Two periods: 2020–2023 and January 2024 – September 2026, to see whether the result lasted.
The test code is ours and the data is public, so the numbers can be checked. This is crypto data only: we don’t have licensed NSE data, so treat Nifty and stock results as untested.
Frequently asked questions
Does the RSI 30/70 strategy work?
Not in our six-year crypto test. Buying when RSI climbed back above 30 and selling when it fell back below 70 lost money on 15-minute, 1-hour, 4-hour and daily charts after costs, even though it won about 51.9% of its trades.
What is the best RSI strategy?
Of the versions we tested, buying RSI pullbacks only in the direction of the daily trend, with a trailing stop instead of a fixed target, did best: +0.24R a trade on 4-hour charts after costs, positive in every year. We tested crypto only.
What is the best RSI setting?
We used the standard length of 14 and didn’t tune it. In trends, levels of 40 and 60 were more useful as pullback points than the classic 30 and 70.
Is RSI good for intraday trading?
All three RSI versions lost on 15-minute charts in our test after fees and slippage.
Why does buying oversold RSI lose money?
In a strong downtrend RSI can stay oversold while price keeps falling. Most oversold bounces are small, and the trades where price keeps going cost a full stop, so losses outweigh the wins.
See your own numbers
Profit Prism Journal measures every trade in R and shows your win rate, RR, leaks and loss limits — for crypto, forex, stocks and F&O. Try it free for 7 days, no card.
Start the free trialFor education only. Not investment advice. Trading involves substantial risk of loss.