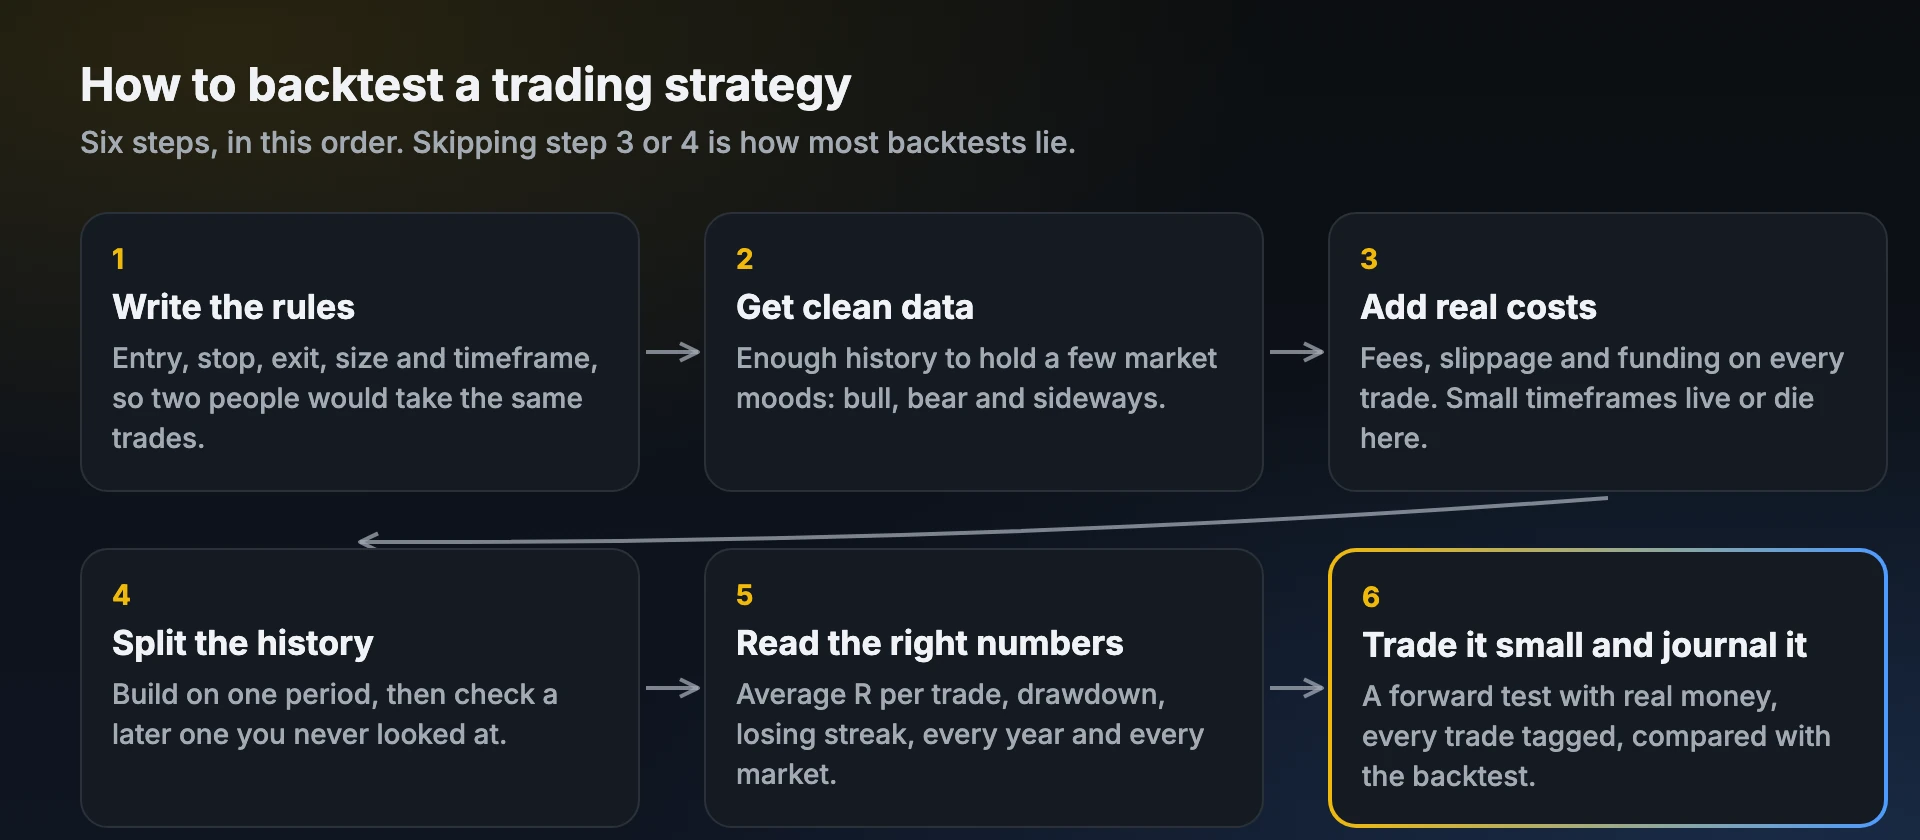
1. Write the rules so a stranger could follow them
A rule like “buy the breakout when the trend looks strong” can’t be tested, because you’ll read “looks strong” differently on a winning chart and a losing one. Write every part down: when you enter, where the stop goes, how you exit, how much you risk and which timeframe you use. Here is one we tested:
Long when a 4-hour candle closes above the highest high of the previous 55 candles and the daily trend is up (daily close above the 50-day EMA, and the 20-day EMA above the 50-day). Stop 2 × ATR(20) below the entry. After each candle closes, move the stop up to the lowest low of the last 20 candles; never move it down. Exit when the stop is hit. Shorts are the mirror image.
If two people with your rules would take different trades, the rules aren’t finished.
2. Get enough data, from more than one kind of market
- Enough trades: at least 100, and more is better. With 30 trades, luck decides the result.
- Different market moods: a strategy tested only in a bull market tells you how it does in a bull market. Our test covers 2020 to 2026: the 2021 boom, the 2022 crash and the years after.
- More than one market: if it only works on one coin or one stock, it may be that market’s past, not an edge.
- Where to get it: exchanges publish crypto candles for free; for Indian markets, brokers’ charting, NSE’s historical data and TradingView all give daily and intraday prices.
3. Add real costs to every trade
This is the step that decides short-timeframe strategies. Every trade pays brokerage or exchange fees, slippage (the gap between the price you wanted and the price you got), and taxes or funding. On a small stop, those costs are a big share of 1R.
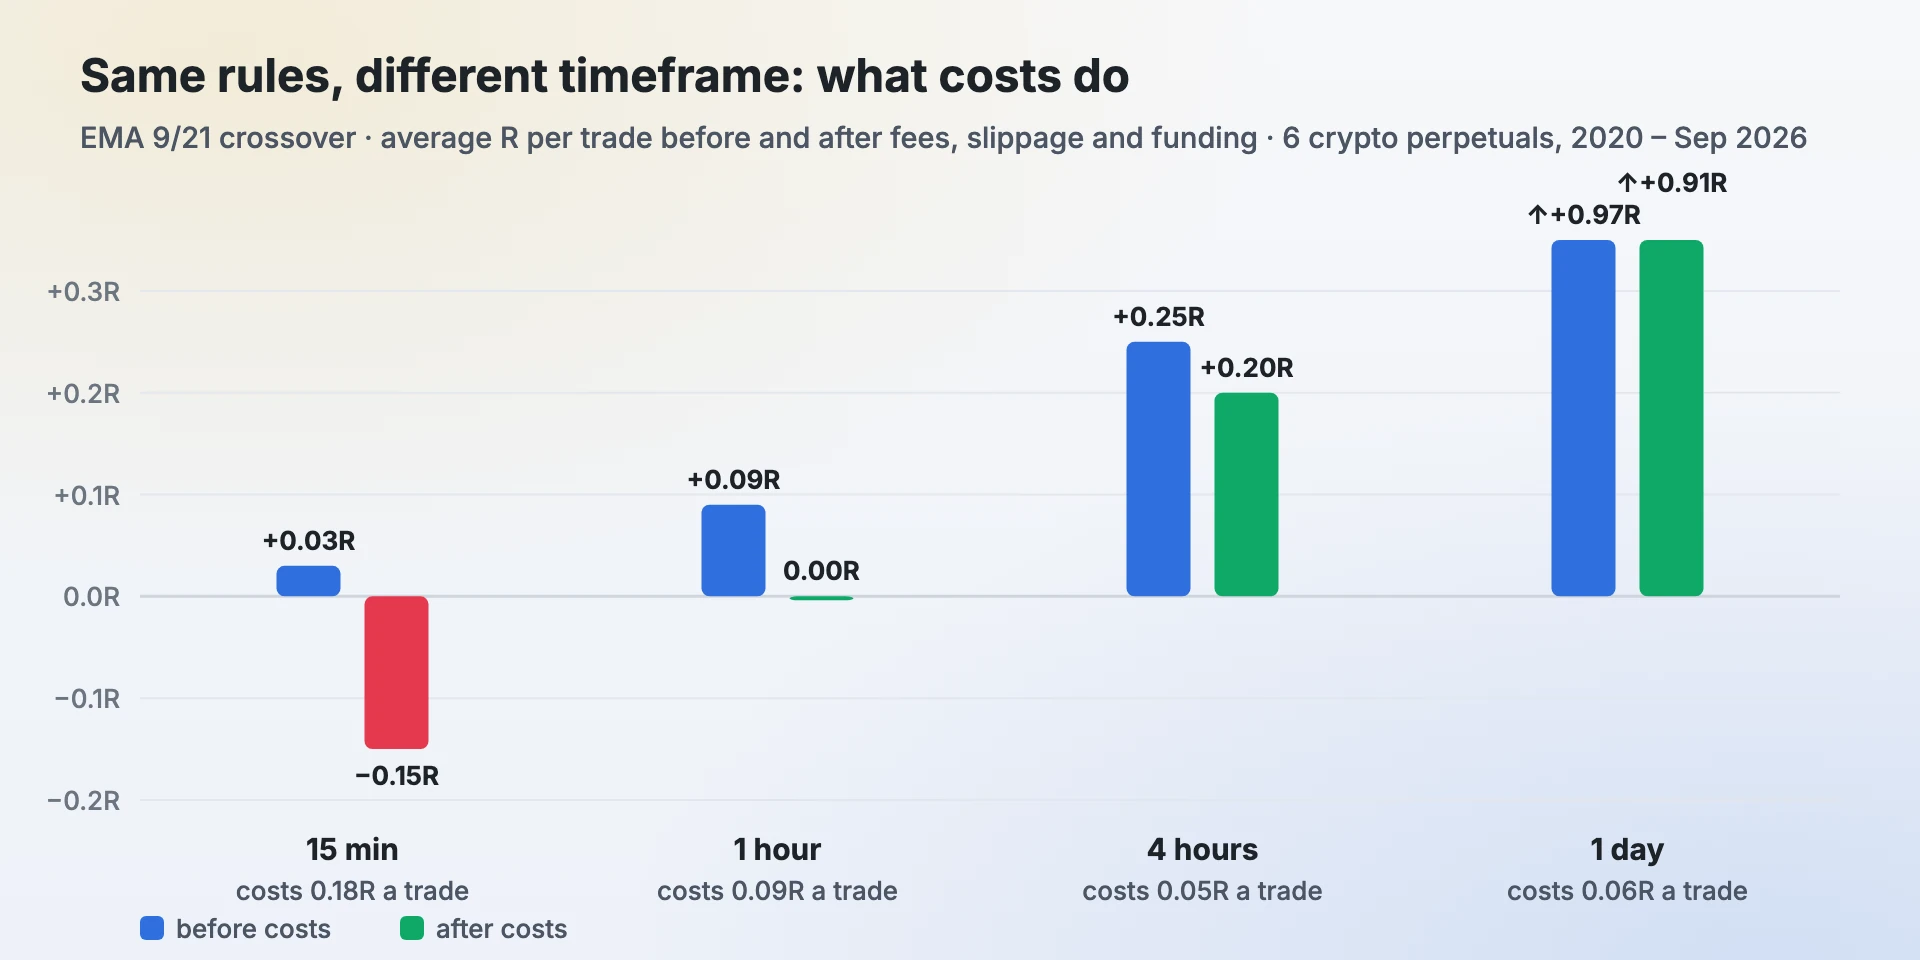
The EMA 9/21 crossover made +0.03R a trade on 15-minute charts before costs and −0.15R after them. On 4-hour charts costs took only 0.05R a trade. In Indian F&O, add brokerage, STT, exchange charges, GST and stamp duty; see overtrading for what they add up to.
4. Split the history and don’t tune on all of it
If you try 50 settings and keep the best, you will find something that worked in the past by chance. That’s called overfitting, and it’s the most common way backtests lie. Two habits protect you:
- Hold back a period. Build and adjust the rules on the earlier years, then run them once on later years you never looked at. If the result collapses, the edge probably wasn’t real.
- Decide before you look. Write the settings down before you see the result. In our tests we used textbook settings, and when we tried new versions of RSI and Bollinger strategies we wrote the four versions into the code before running any of them. One held up; three didn’t.
5. Read the numbers that matter
Total profit is the least useful number in a backtest, because it grows with the number of trades. These tell you more:
| Number | What it tells you | Donchian + trend, 4 hours |
|---|---|---|
| Average R per trade (after costs) | The edge: what one trade makes on average, per unit of risk | +0.52R |
| Win rate with average win and loss | How the edge is made, and how it will feel | 32.6%, +3.47R / −0.91R |
| Maximum drawdown | The deepest fall from a high; the pain you must sit through | 37R across six coins |
| Longest losing run | How many losses in a row to expect | 40 |
| Years and markets positive | Whether the edge is steady or came from one lucky stretch | 7 of 7 years, 6 of 6 coins |
| Early vs late period | Whether it still works | +0.67R (2020–23), +0.34R (2024–26) |
Use the risk reward calculator to see which win rate a given RR needs to break even, and the max drawdown guide for how deep a fall your account can take.
Mistakes that make backtests lie
- Look-ahead bias: using information you wouldn’t have had at the time, such as a candle’s close before it closed or today’s daily trend before the day ended.
- Overfitting: tuning settings until the past looks perfect.
- Too few trades: 20 trades can show almost anything.
- No costs, or too-low costs: especially on short timeframes.
- Best-case fills: when one candle touches both your stop and your target, you don’t know which came first. Count the stop.
- A hand-picked period: testing only the months when the idea worked.
- Survivorship bias: testing only today’s winners (stocks still listed, coins still popular) and ignoring the ones that died.
Backtesting by hand vs with code
You don’t need to code. A manual backtest uses bar replay: you hide the future, step forward one candle at a time and take every signal your rules give, writing each trade down. It’s slow, but it trains your eye and works for rules that are hard to code, such as reading structure. Code (TradingView’s strategy tester, Python, or a spreadsheet) is faster and can test years in seconds, but only tests what you can define exactly. Many traders do both: code for the rough idea, replay for the judgement.
6. Trade it small and journal every trade
A backtest is a baseline, not a promise. The last step is a forward test: trade the strategy with real money but small size for 50–100 trades, tag each trade with the strategy in your journal, and compare your average R with the backtest. If you’re close, size up slowly. If you’re far below it, find out where the difference comes from: missed signals, early exits, or costs you didn’t count.
Frequently asked questions
How many trades do I need to backtest a strategy?
At least 100, and more is better. With 20 or 30 trades a strategy can look great or terrible by chance. Test across several years and more than one market as well.
What is a good result in a backtest?
A positive average R per trade after all costs, in most years and most markets you tested, with a drawdown and losing run you could live through. A strategy that only works in one period or one market is probably fitted to the past.
What is overfitting in backtesting?
Overfitting is tuning a strategy’s settings until they fit past data closely. The result looks excellent in the backtest and fails on new data. Testing the final rules once on a period you held back is the simplest check.
Can I backtest without coding?
Yes. Use bar replay on a chart to step through history one candle at a time, take every signal your rules give and record each trade in a spreadsheet or journal. It’s slower than code but works for any rule you can describe.
Should I include fees in a backtest?
Always. On short timeframes fees and slippage can take more than a strategy earns. In our tests, costs took 0.10 to 0.18R from every 15-minute trade and under 0.10R on 4-hour charts.
See your own numbers
Profit Prism Journal measures every trade in R and shows your win rate, RR, leaks and loss limits — for crypto, forex, stocks and F&O. Try it free for 7 days, no card.
Start the free trialFor education only. Not investment advice. Trading involves substantial risk of loss.