The results at a glance
Average R per trade after all costs, across six coins (BTC, ETH, SOL, XRP, BNB, DOGE), January 2020 to September 2026. 1R is what one trade risked, so +0.20R means a trade made a fifth of its risk on average. Strategies with their own page are linked.
| Strategy | Type | 15 min | 1 hour | 4 hours | 1 day | Win rate, 4 hours |
|---|---|---|---|---|---|---|
| Donchian breakout + daily trend | Trend following | −0.02R | +0.20R | +0.52R | +3.56R | 32.6% |
| Donchian breakout, no filter | Trend following | −0.11R | +0.07R | +0.34R | +3.42R | 30.6% |
| Golden cross / death cross (SMA 50/200) | Trend following | +0.06R | +0.38R | +1.17R | +0.50R | 29.3% |
| EMA 9/21 crossover | Trend following | −0.15R | 0.00R | +0.20R | +0.91R | 25.7% |
| Supertrend (10, 3) | Trend following | −0.06R | +0.05R | +0.18R | +0.99R | 36.8% |
| Bollinger Bands breakout | Breakout | −0.17R | +0.02R | +0.16R | +0.49R | 32.5% |
| RSI pullback with the trend | Pullback in a trend | −0.14R | +0.03R | +0.24R | +0.22R | 30.8% |
| MACD signal-line cross | Momentum | −0.17R | −0.04R | +0.02R | +0.22R | 32.2% |
| RSI 30/70 reversal | Mean reversion | −0.16R | −0.12R | −0.08R | −0.09R | 51.9% |
| Bollinger Bands reversal | Mean reversion | −0.18R | −0.13R | −0.11R | −0.10R | 50.8% |
| Bollinger lower-band buy with the trend | Pullback in a trend | −0.18R | −0.10R | −0.08R | +0.18R | 39.7% |
| Opening range breakout, 00:00 UTC open | Intraday breakout | −0.23R | – | – | – | 33.1% (15 min) |
| Opening range breakout, New York open | Intraday breakout | −0.14R | – | – | – | 38.6% (15 min) |
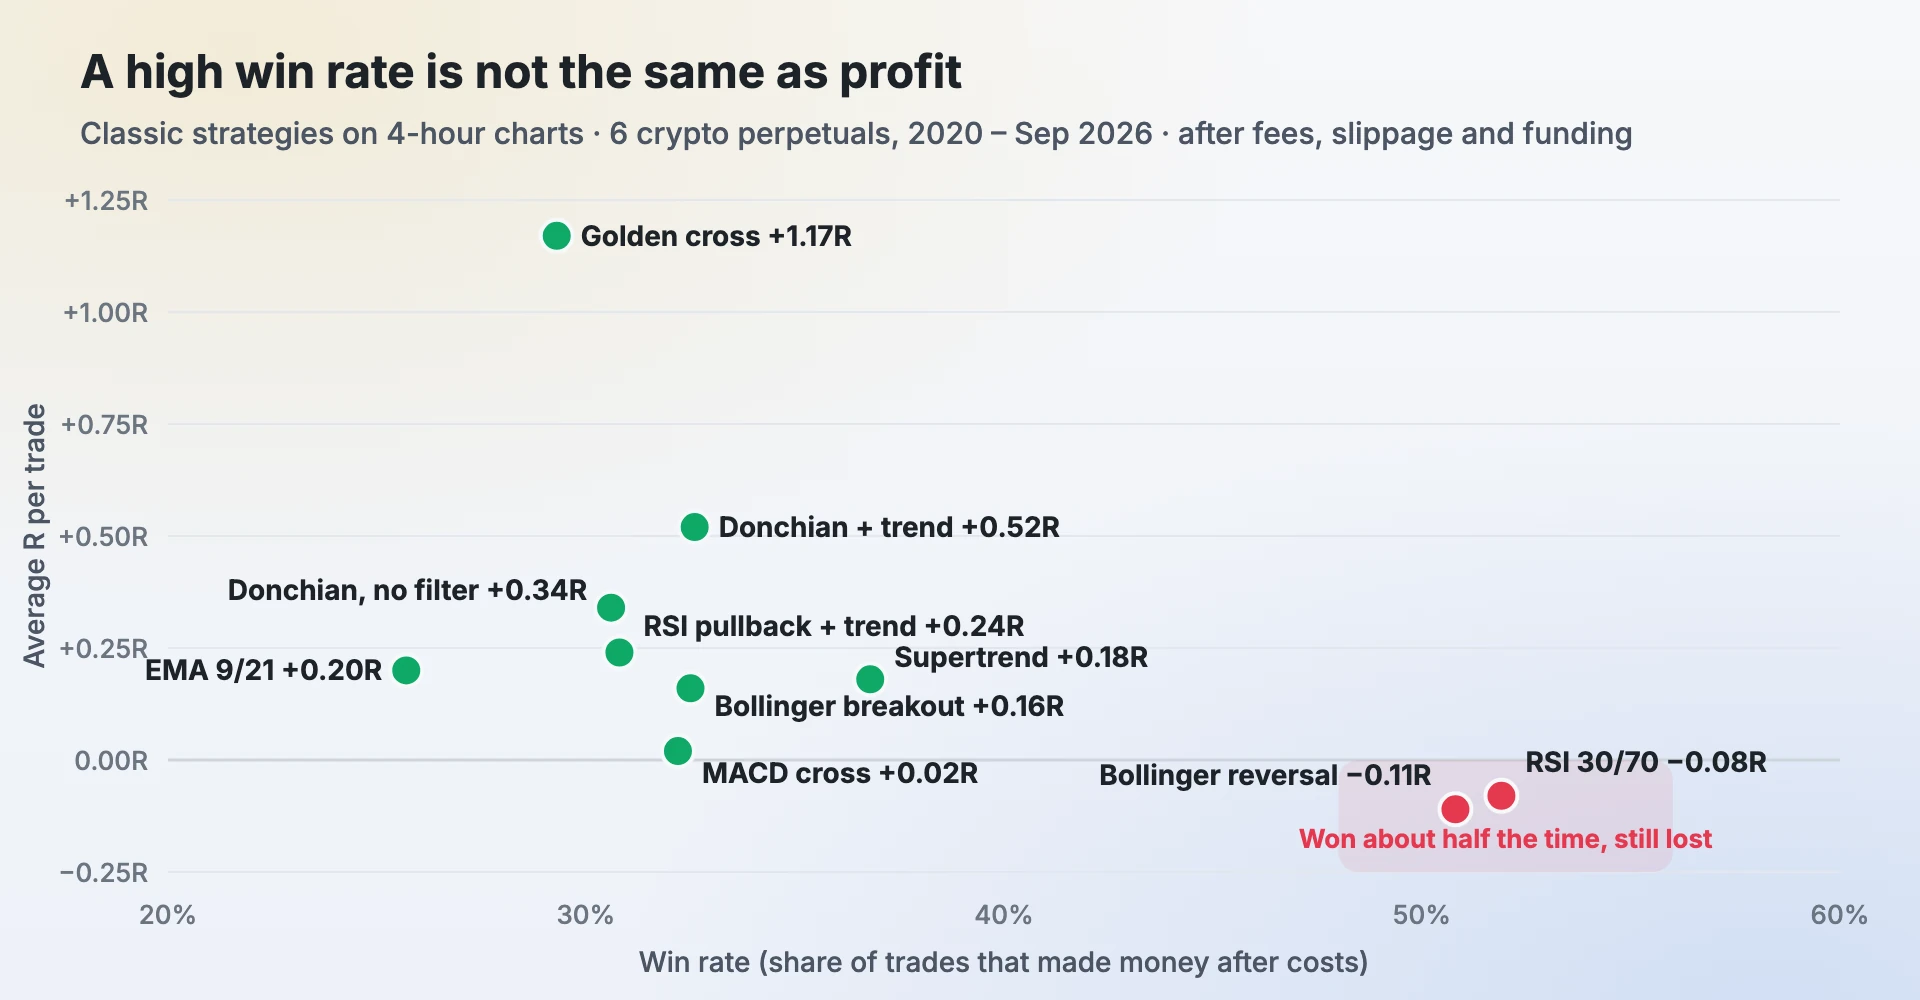
What we found
- Trend following worked on 4-hour and daily charts. Donchian breakouts, the golden cross, the EMA 9/21 cross, Supertrend and Bollinger breakouts were all positive on 4-hour charts on all six coins and in both periods. They win only about a quarter to a third of their trades; a few big winners pay for many small losses.
- Buying dips and selling rips lost. RSI 30/70 and Bollinger Band reversals won about 51.9% of their trades and still lost on every timeframe, because the average loss (−0.99R) was bigger than the average win (+0.75R). A high win rate isn’t an edge.
- On 15-minute charts almost everything lost. Costs took 0.10–0.18R from every trade, more than most strategies make. Both opening range breakouts lost. See trading fees by timeframe.
- Results shrank after 2024. Donchian with the daily trend made +0.67R a trade on 4-hour charts in 2020–2023 and +0.34R from 2024. Still positive, but a backtest’s best years rarely repeat.
- Most of the profit came from longs. Crypto rose over these years, and trend strategies earned their R mainly on the long side. Shorts were close to zero.
- Even the winners had long losing runs. 16 to 40 losses in a row across six coins on 4-hour charts. If a run of 20 losses would make you quit, these strategies will test you.
- Using RSI the way traders often do helped. Taking RSI pullbacks only in the direction of the daily trend, with a trailing exit, turned a losing indicator into one of the steadier results: +0.24R a trade on 4-hour charts, positive in all 7 years.
Crypto rose a lot between 2020 and 2026, so trend-following strategies earned most of their R on longs. A market that falls or goes sideways for years would give a different result. Past results don’t predict future ones.
Types of trading strategies
Almost every strategy is one of a few ideas. Knowing which one you trade tells you what to expect from it.
| Type | The idea | What to expect | Examples tested here |
|---|---|---|---|
| Trend following | Buy strength, sell weakness, stay in while the trend lasts | Low win rate (25–40%), a few big winners, long losing runs in sideways markets | Donchian, golden cross, EMA cross, Supertrend |
| Breakout | Enter when price leaves a range or a band | Many false breakouts, paid for by the ones that run | Bollinger breakout, opening range breakout |
| Mean reversion | Fade a stretched move back to the average | High win rate, small wins, the occasional large loss when the move keeps going | RSI 30/70, Bollinger reversal |
| Pullback in a trend | Trade with the trend, enter on a dip | Between the two: better entries, but some dips become reversals | RSI pullback with the trend |
| Momentum | Follow the change in speed of price | Many signals; most of the edge goes to costs on short charts | MACD cross |
The timeframe matters as much as the type. Intraday trading and scalping use 1- to 15-minute charts, where costs are a large share of each trade. Swing trading uses 1-hour to daily charts and holds for days. Positional trading uses daily and weekly charts and holds for weeks. In our data the same rules did far better on 4-hour and daily charts than on 15-minute ones.
How we tested it
- Markets: BTC, ETH, SOL, XRP, BNB and DOGE USDT perpetual futures (public exchange candles), each from its first candle; trades counted from 1 January 2020 to 30 September 2026.
- Rules: the textbook settings above, chosen before we saw any result and never tuned. One trade at a time per coin; a trade still open on 30 September 2026 isn’t counted.
- Fills: entries at the close of the signal candle. A stop is a stop order: it fills at the stop, or at the open if a candle gaps through it. If one candle touches both the stop and a target, we count the stop.
- Costs on every trade: 0.05% exchange fee and 0.02% slippage on each side, plus the real funding payments while the trade was open.
- Results in R: 1R is the distance from entry to the first stop, so a +2R trade made twice what it risked. This lets BTC at 60,000 and DOGE at 0.20 sit in one table.
- Two periods: 2020–2023 and January 2024 – September 2026, to see whether the result lasted.
The test code is ours and the data is public, so the numbers can be checked. This is crypto data only: we don’t have licensed NSE data, so treat Nifty and stock results as untested.
Rules vs judgement
These tests follow each rule exactly. Most traders don’t: they read the candles, the structure and the context, and they adapt how they use a concept as markets change. That’s a real skill, and it can make results better than a fixed rule, or worse. The rule’s numbers are a baseline. Your journal tells you which side of it you’re on: tag every trade with its strategy and compare your average R with the baseline after 50 or more trades.
How to choose a strategy
- Start from your time. If you can’t watch a screen all day, 4-hour and daily charts suit you, and in our tests they also cost far less.
- Check the losing run, not just the win rate. Could you take 20 losses in a row and keep going? If not, risk less per trade (see position sizing) or pick a strategy with shorter runs.
- Know the costs. On a short chart, find out what fees and slippage take in R before you look at anything else.
- Test it the way you’ll trade it. Read how to backtest a trading strategy, then forward-test with small size and a journal.
Frequently asked questions
What is the most profitable trading strategy?
No strategy is profitable everywhere. In our six-year crypto test, trend-following strategies such as the golden cross, Donchian breakouts and the EMA 9/21 cross did best on 4-hour and daily charts, but their results shrank after 2024 and most of their profit came from longs in a rising market.
Which trading strategy has the highest win rate?
In our test, RSI 30/70 and Bollinger Band reversals won about half their trades, the most of any strategy, and still lost money on every timeframe because their losses were bigger than their wins. Win rate alone doesn’t tell you if a strategy makes money.
Do trading strategies work on 15-minute charts?
Almost none did in our test. Fees, slippage and funding took 0.10 to 0.18R from every trade on 15-minute charts, more than most strategies earned. The same rules did much better on 4-hour and daily charts.
Can I use these results for Nifty or stocks?
Not directly. We tested crypto perpetual futures only, because we don’t have licensed NSE data. Trend and reversal ideas exist in every market, but results and costs differ, so test a strategy on the market you trade.
Is a backtest the same as real trading?
No. A backtest follows the rules exactly and uses past data. Real trading adds your own decisions, missed signals and changing markets. Use a backtest as a baseline and measure your real trades against it in a journal.
See your own numbers
Profit Prism Journal measures every trade in R and shows your win rate, RR, leaks and loss limits — for crypto, forex, stocks and F&O. Try it free for 7 days, no card.
Start the free trialFor education only. Not investment advice. Trading involves substantial risk of loss.